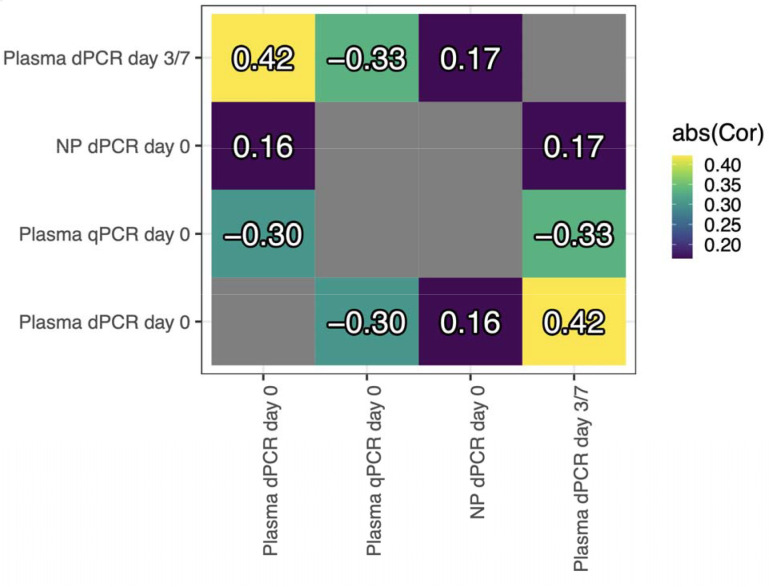
Figure 1. Pairwise Pearson’s correlations between measures of nasopharyngeal (NP) and plasma SARS-CoV-2 RNA load.
Colors reflect absolute pairwise correlation, as qPCR cycle thresholds are expected to be inversely proportional to SARS-CoV-2 RNA concentrations as measured by dPCR. Plasma RNA concentration by dPCR at enrollment (“Plasma dPCR day 0”) is modestly negatively correlated (r = −0·30) with qPCR Ct on the same specimen, moderately correlated with plasma dPCR on day 3/7 (r = 0·42), and poorly correlated with RNA concentration in the nasopharynx (r = 0·16), suggesting that RNAaemia is weakly related to nasopharyngeal viral load. NP = nasopharyngeal swab. qPCR = quantitative PCR. dPCR = digital PCR.

