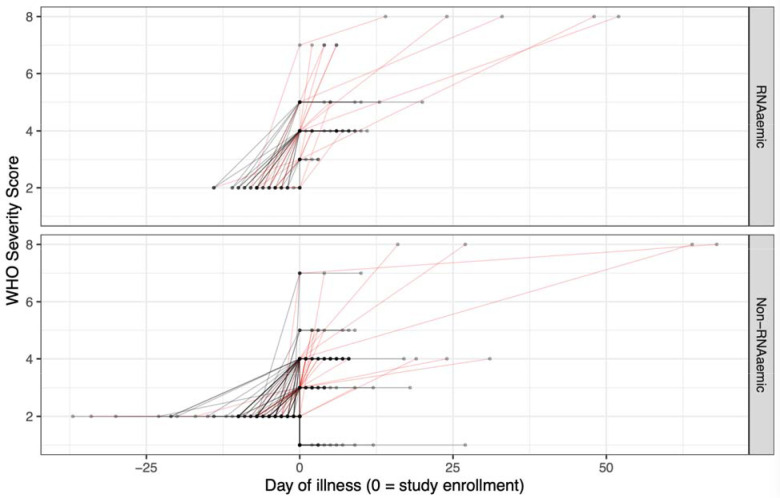
Figure 5. Trajectories of patient severity, by RNAaemia on initial presentation.
36·4% (16/44) of initially RNAaemic patients, and 19·0% (28/147) of non-RNAaemic patients worsened in severity after initial presentation (difference = 17·4% [95% CI of difference, 0·3% - 34·4%]). RNAaemic patients worsened by a median of three points on the modified WHO scale, compared to one point for non-RNAaemic patients (p = 0·02, Wilcoxon rank-sum test with continuity correction). Day zero represents day of patient enrollment. Values prior to day zero are based on patient’s first reported day of symptoms. Values after day zero are based on the date of each patient’s maximum WHO score. Red trajectories are those that increase in severity after presentation, by modified WHO score.

