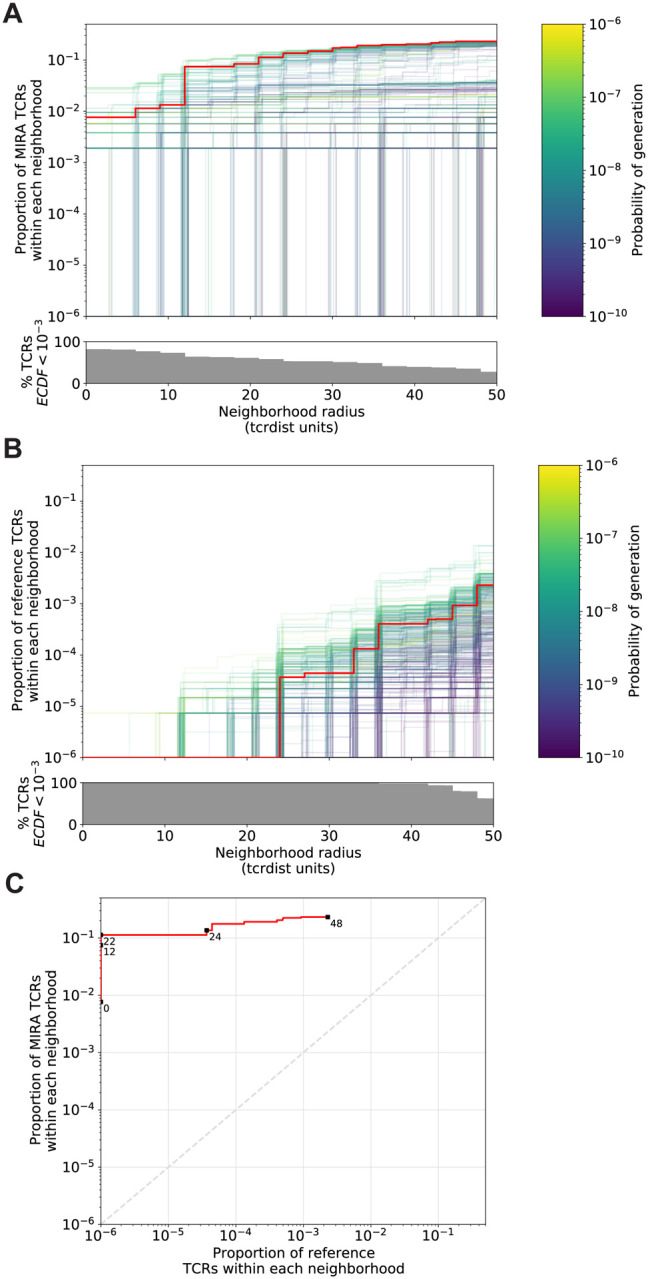
Figure 3. Radius-defined neighborhood densities within an antigen-enriched and a synthetic background repertoire.

(A) Each TCR in the MIRA55 antigen-enriched sub-repertoire (one line) acts as the centroid of a neighborhood and an empirical cumulative distribution function (ECDF) is estimated over a range of distance radii (x-axis). Each ECDF shows the proportion of TCRs within the sub-repertoire having a distance to the centroid less than the indicated radius. The ECDF line color corresponds to the TCR generation probability estimated using OLGA (Pgen). The ECDF curves are randomly shifted by <1 unit along the x-axis to reduce overplotting. The bottom panel shows the percentage of TCRs with an ECDF proportion < 10–3. (B) Estimated ECDF for each MIRA55 TCR based on the proportion of TCRs in a synthetic background repertoire that is within the indicated radius (x-axis). The synthetic background was generated using 100,000 OLGA-generated TCRs and 100,000 TCRs sub-sampled from umbilical cord blood; sampling was matched to the VJ-gene frequency in the MIRA55 sub-repertoire, with inverse probability weighting to account for the sampling bias (see Methods for details). (C) Antigen-enriched ECDF (y-axis) of one example TCR’s neighborhood (red line) plotted against ECDF within the synthetic background (x-axis). Example TCR neighborhood is the same indicated by the red line in (A) and (B). The dashed line indicates neighborhoods that are equally dense with TCRs from the antigen-enriched and unenriched background sub-repertoires.
