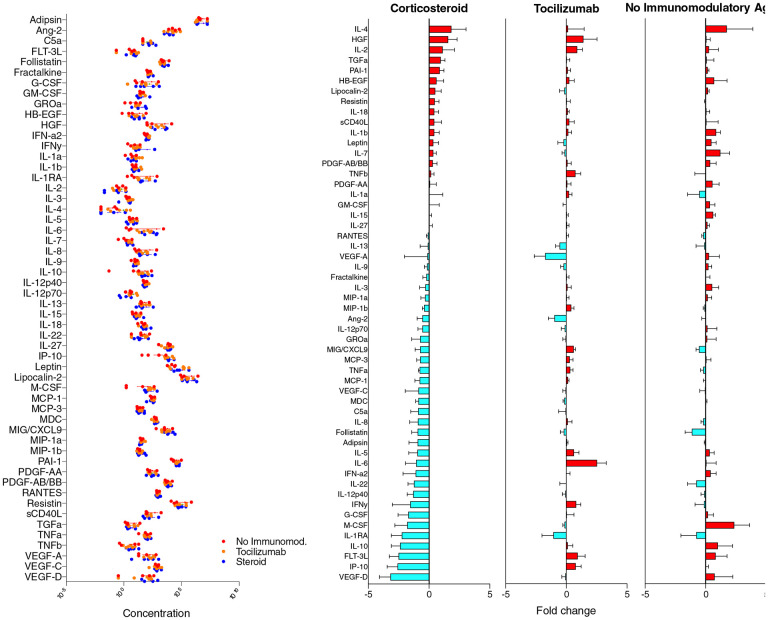
Figure 1. Comparison of circulating COVID-19 related biomarkers in response to immunomodulatory therapy.
Left panel demonstrates baseline concentration of plasma biomarkers from hospitalized patients with COVID-19 are shown. All concentrations are in pg/mL except for C5a (complement 5a) which is ng/mL. Right panels depict changes in concentration of circulating biomarkers between days 1 and 4 of hospitalization grouped by corticosteroid (left), tocilizumab (middle), and no immunomodulatory therapy (right).

