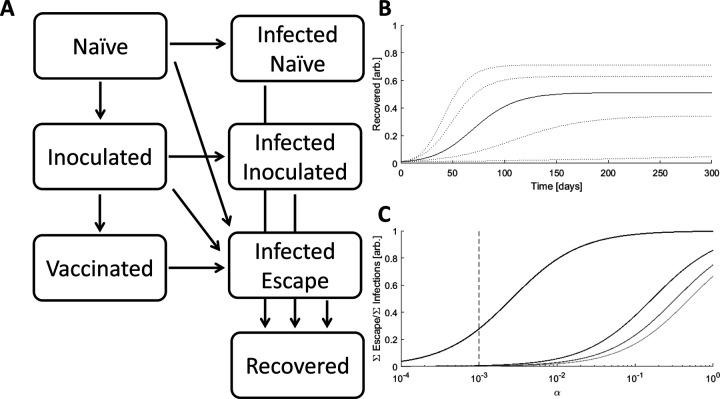
Figure 1. The Model.
A. Schematic of the 7 compartment model with three susceptible, three infected, and one recovered compartments. B. Simulated epidemics for kI=[0.15,0.175,0.2(solid line),0.225,0.25], α=0.001, β=0.01 C. The ratio of cumulative escape infections to all cumulative infections for an epidemic over a range of α. β=[0.5,0.67,0.83,1], darker color indicates higher value, kI=0.2. The dotted line specifies the benchmark value of α=0.001.

