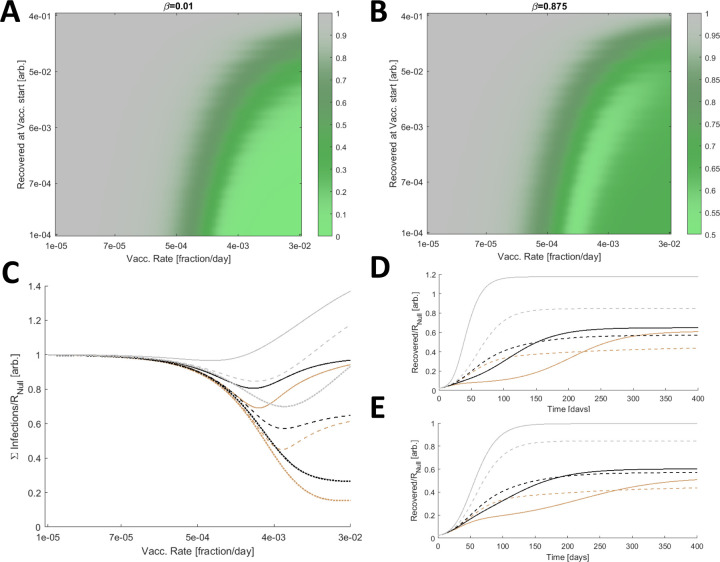
Figure 2. Optimal Vaccine Distribution.
A. The cumulative number of infections relative to no vaccination, RNull, for a range of vaccine initiations and distribution rates. Here β is low, 0.01. B. The cumulative number of infections relative to no vaccination, RNull, for a range of vaccine initiations and distribution rates and a large β (0.875). A/B. 3840 values were computed for each panel and 4× by 4× bilinearly interpolated points are displayed. C. The cumulative number of infections relative to no vaccination, RNull, for β=[0.75(dotted),0.875(dashed),1(solid)] and three relative contact rates, q=[0.2(brown),1(black),5(gray)]. D. Simulated epidemics comparing a high fixed rate of vaccination, kV=0.03 (solid) representing the inoculation of 3% of Naïve hosts per day, and the optimal vaccination rate for each condition (dashed). β=0.875 is fixed and q=[0.2(brown),1(black),5(gray)]. E. Same as D. with a low fixed rate of vaccination, kV=0.01. C/D/E. The minima for the dashed lines in C correspond to the dashed lines in D/E.

