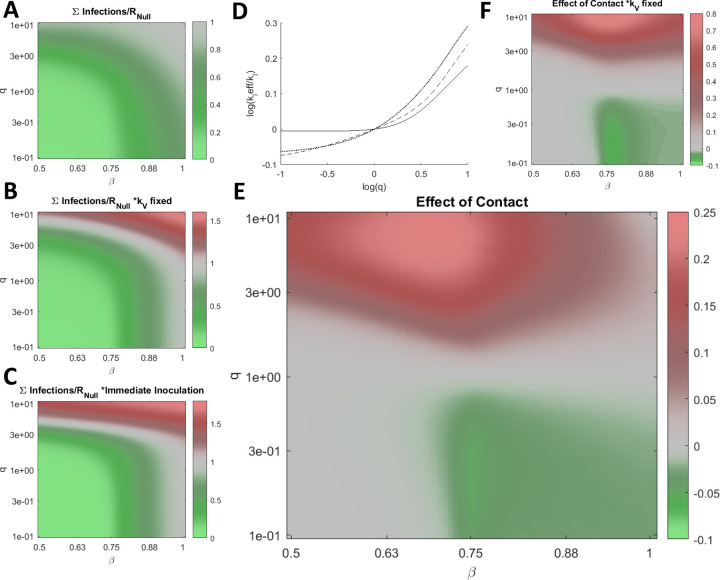
Figure 3. Post-vaccination contacts.
A. The cumulative number of infections relative to no vaccination, RNull, for a range of β and q, optimizing kV for each condition. B. Same as in A. for fixed kV=0.03 representing the inoculation of 3% of Naïve hosts per day. C. Same as in A. for the case where all Naïve hosts are immediately inoculated. D. Log of the effective kI, kIeff, relative to kI=0.2, the benchmark, vs. log of q for β=[0.5 (dotted line), 0.7 (dashed line), 1 (solid line)]. E. The cumulative number of infections relative to RNull and q=1 scaled by the fraction of infections due to vaccine escape, ∑Escape(q)/∑Infections(q)(∑Infections(q)-∑Infections(q=1))/RNull, for a range of β and q, optimizing kV for each condition. F. Same as in E for fixed kV=0.03. A-C/E/F. 961 values were computed for each panel and 4× by 4× bilinearly interpolated points are displayed.

