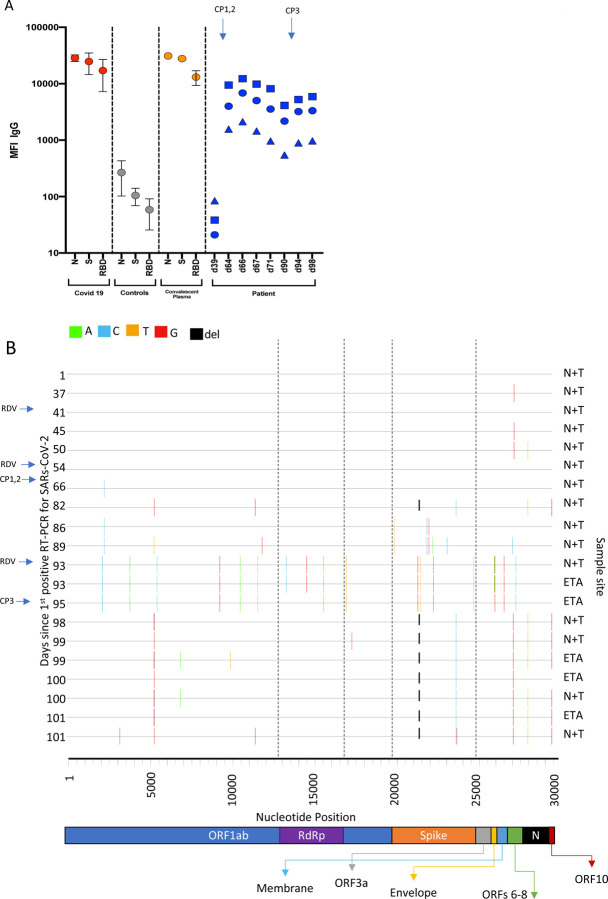
Figure 3. Serum SARS-CoV-2 antibody levels and virus population changes in chronic SARS-CoV-2 infection.
A. Anti SARS-CoV-2 IgG antibodies in patient and pre/post convalescent plasma compared to RNA+ Covid19 patients and prepandemic healthy controls: Red, grey and gold: IgG antibodies to SARS-CoV2 nucleocapsid protein (N), trimeric S protein (S) and the receptor binding domain (RBD) were measured by multiplexed particle based flow cytometry (Luminex) in RNA+ Covid 19 patients (N=20, red dots), Pre-pandemic healthy controls (N=20, grey dots) and in the convalescent donor plasma (orange dots); Results are shown as mean fluorescent intensity (MFI) +/− SD. Patient sera over time in blue: Anti SARS-CoV2 IgG to N (blue squares), S (blue circles) and RBD (blue triangles). Timing of CP units is also shown B. Highlighter plot indicating nucleotide changes at consensus level in sequential respiratory samples compared to the consensus sequence at first diagnosis of COVID-19. Each row indicates the timepoint the sample was collected (number of days from first positive SARSCoV-2 RT-PCR). Black dashed lines indicate the RNA-dependent RNA polymerase (RdRp) and Spike regions of the genome. There were few nucleotide substitutions between days 1–54, despite the patient receiving two courses of remdesivir. The first major changes in the spike genome occurred on day 82, following convalescent plasma given on days 63 and 65. The amino acid deletion in S1, ΔH69/V70 is indicated by the black lines. Sites: Endotracheal aspirate (ETA) or Nose/throat swabs (N+T).

