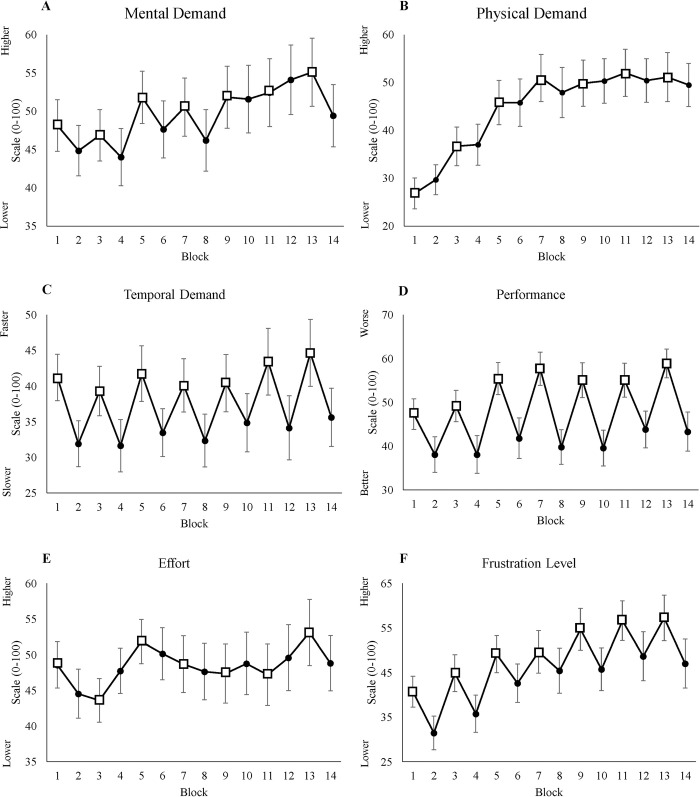
Fig 3. NASA-TLX scales.
(A) Average score of mental demand for each block. (B) Average score of physical demand for each block. (C) Average score of temporal demand for each block. (D) Average score of performance for each block. (E) Average score of subjective effort for each block. (F) Average score of frustration level for each block. All figures’ y-axes show the score for each scale from 0 to 100, and x-axes show blocks, where odd blocks represented by square markers are the low motivation blocks. Error bars in each block represent standard errors.

