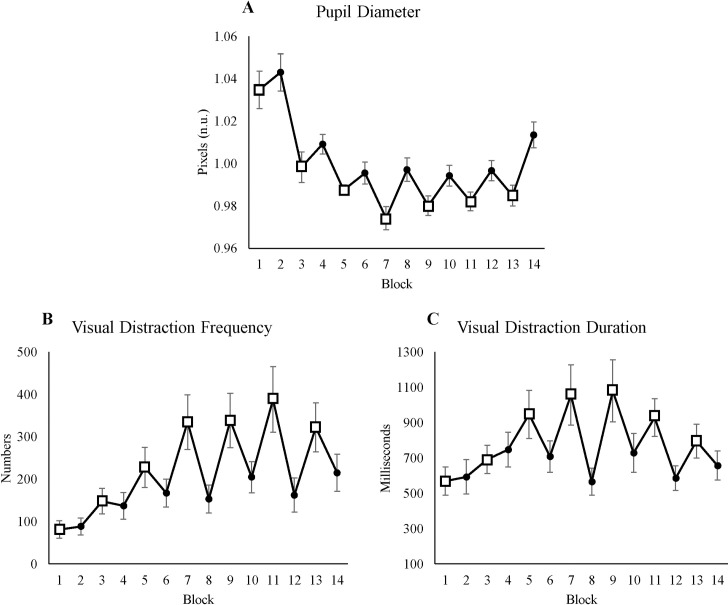
Fig 6. Pupil diameter and visual distraction.
(A) Average pupil diameter for each block. (B) Average visual distraction frequency for each block. (C) Average visual distraction duration for each block. All figures’ y-axes show their value respectively, and x-axes show blocks, where odd blocks represented by square markers are the low motivation blocks. Error bars in each block represent standard errors.

