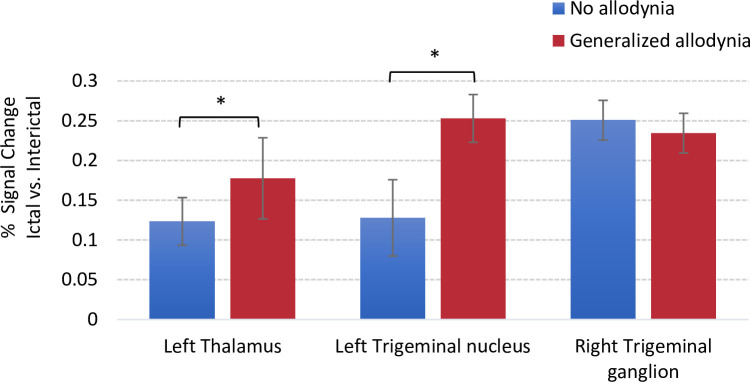
Fig 5. Signal change differences along the trigeminal pathway based on Region of Interest (ROI) analysis.
Signal change values were extracted using Featquery. For those patients who received thermal stimulation on the right side, the brains were flipped along the y-axis so that all images were in accordance regarding the site of the migraine (and the stimulation side). The left side is the ipsilateral stimulation side and the right is the contralateral stimulation side. The group average results for percentage signal change between generalized and no allodynia groups are shown for the left thalamus and left trigeminal nucleus ipsilateral to the side of stimulation. For the trigeminal ganglion, the signal change is reported for the contralateral region (right side). Error bars represent standard deviations. The * symbol indicates group differences at a significant level of p < 0.05.

