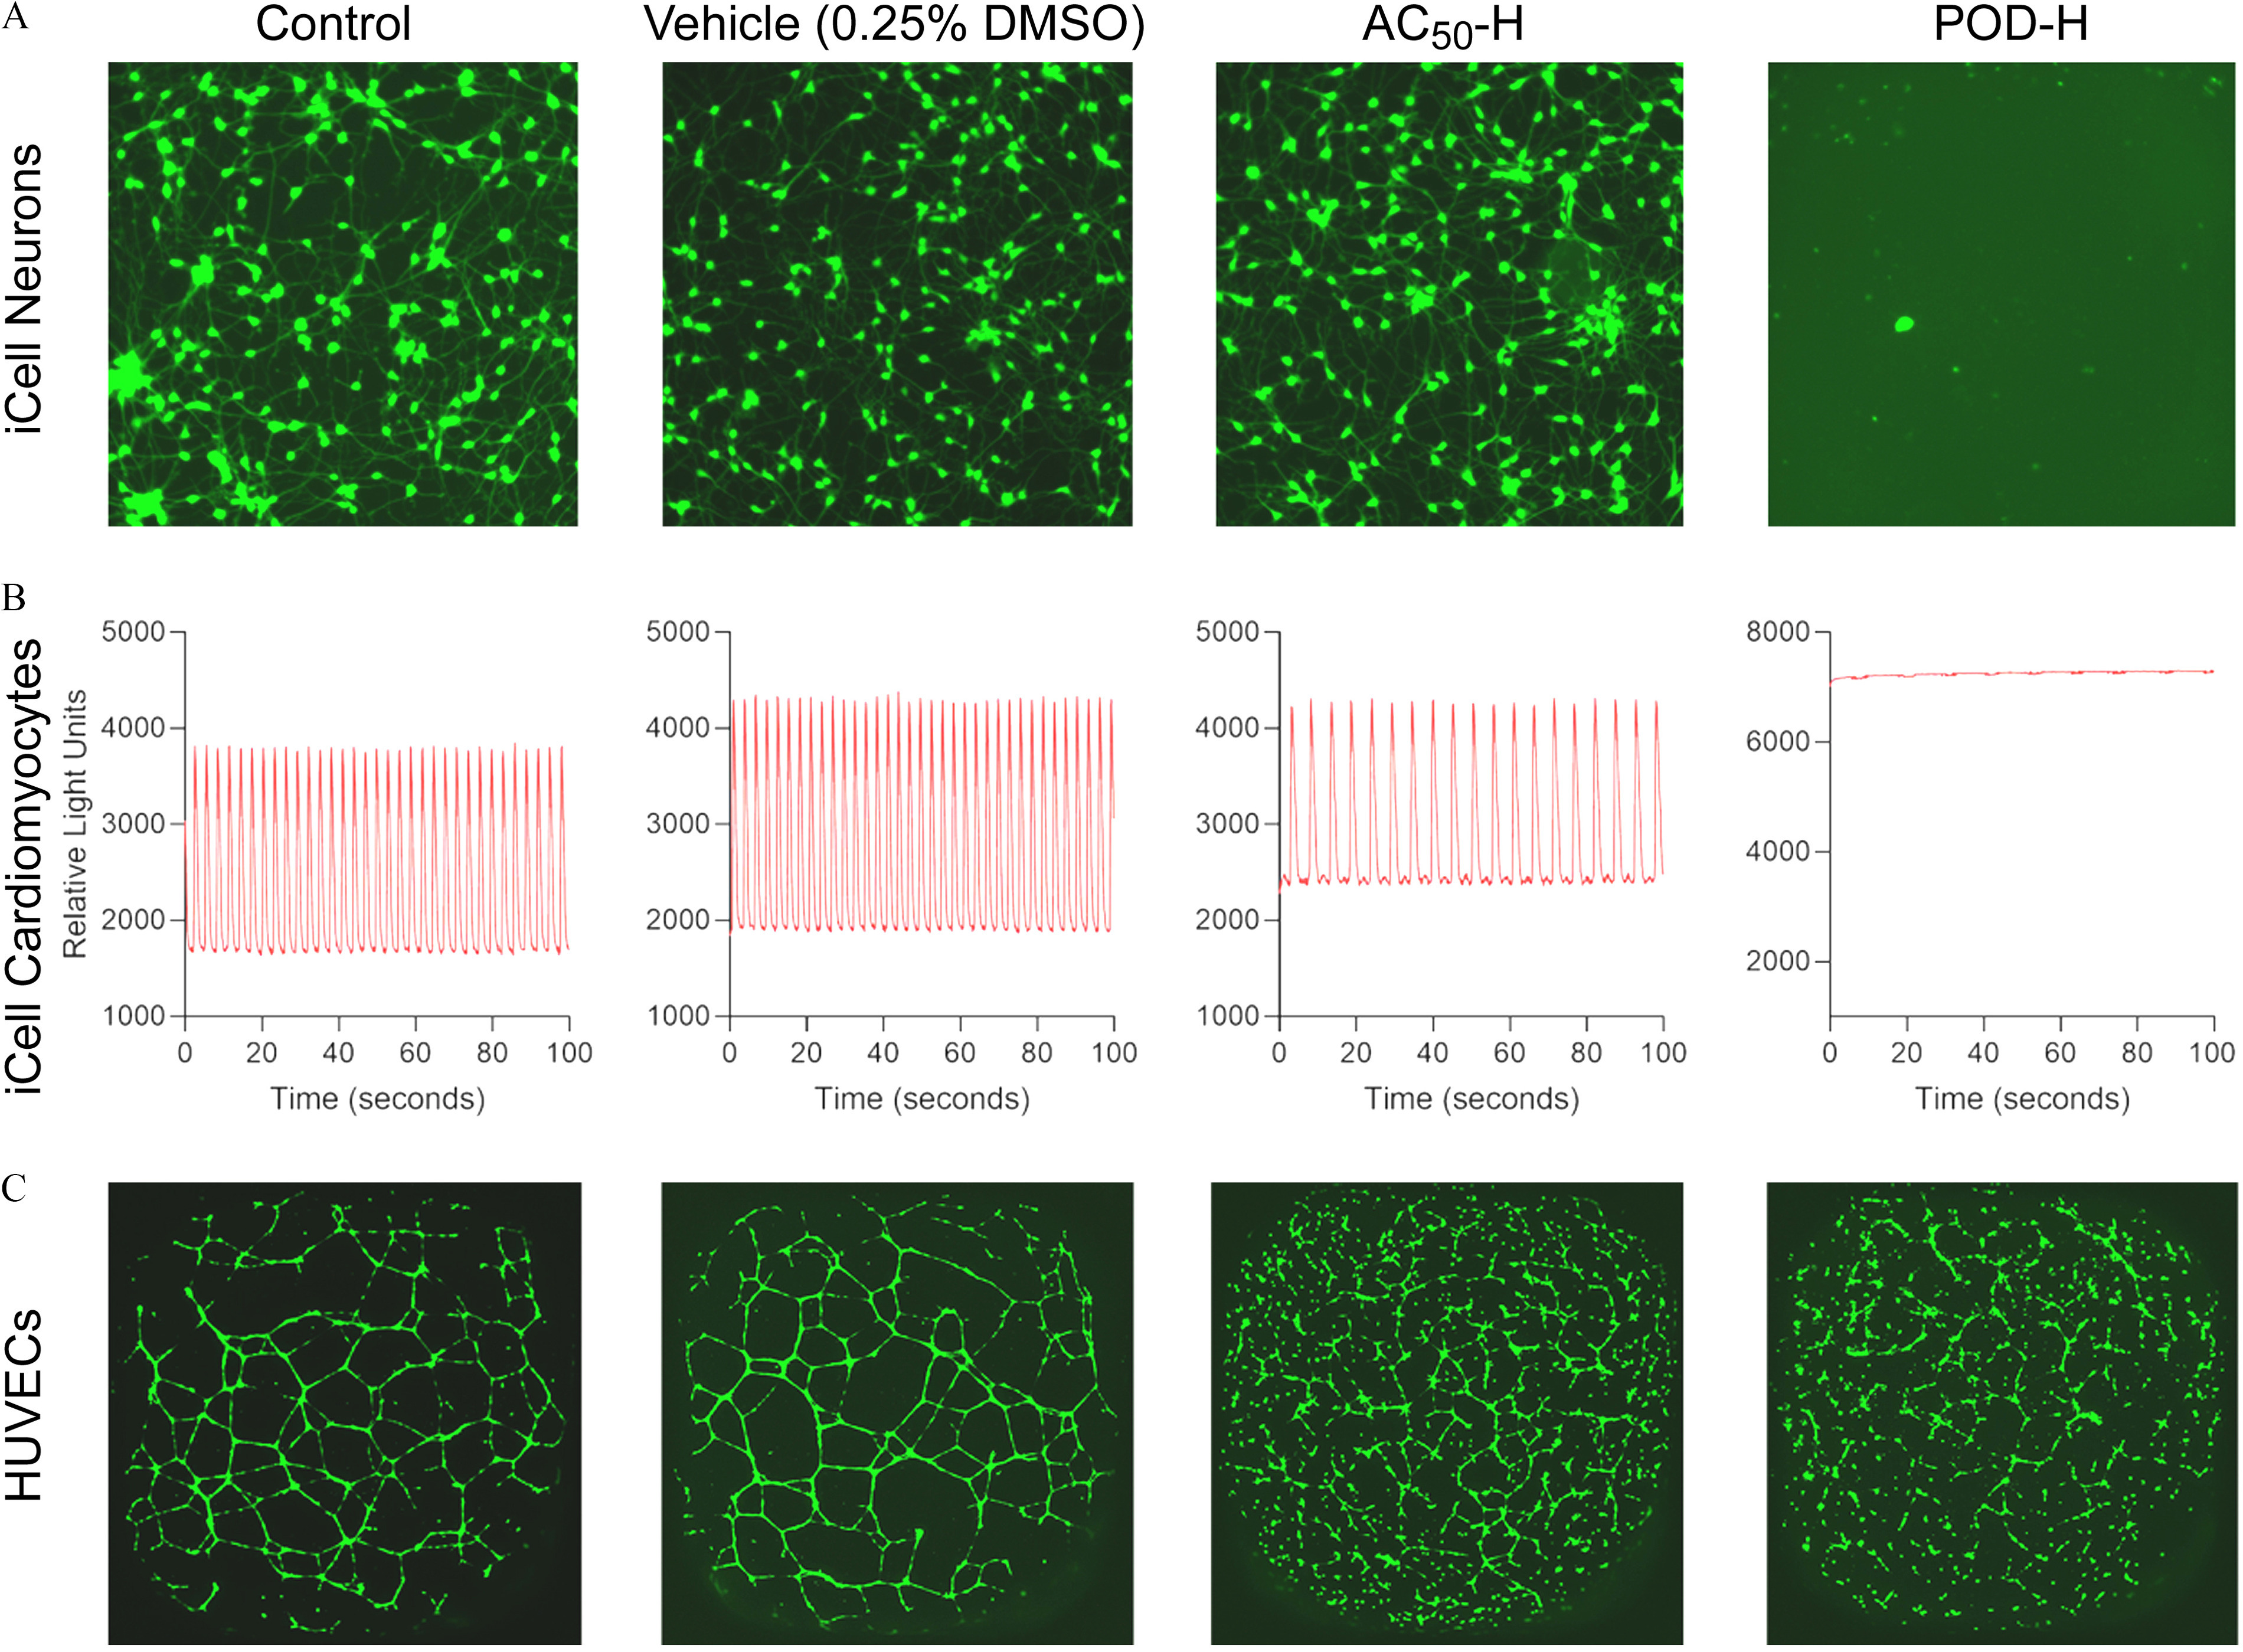
Figure 3.

Representative examples of bioactivity in different cell types. (A), fluorescent (calcein) staining () of untreated (control) iCell neurons or cell treated with vehicle, or two designed mixtures ( at lowest tested concentration, diluted by from the highest concentration, and POD-H at an intermediate tested concentration, diluted by from the highest concentration). See acronym explanations and description of the designed mixtures in Table 1. (B), characteristic kinetic imaging-derived fluorescence intensity traces indicative of the fluxes across cell membranes of iCell cardiomyocytes that spontaneously contract in cell culture. (C), fluorescent (calcein) staining () of untreated (control) HUVECs or cell treated with vehicle, or two designed mixtures. See Table 1 for description of designed mixtures and POD-H.
