
Figure 5.
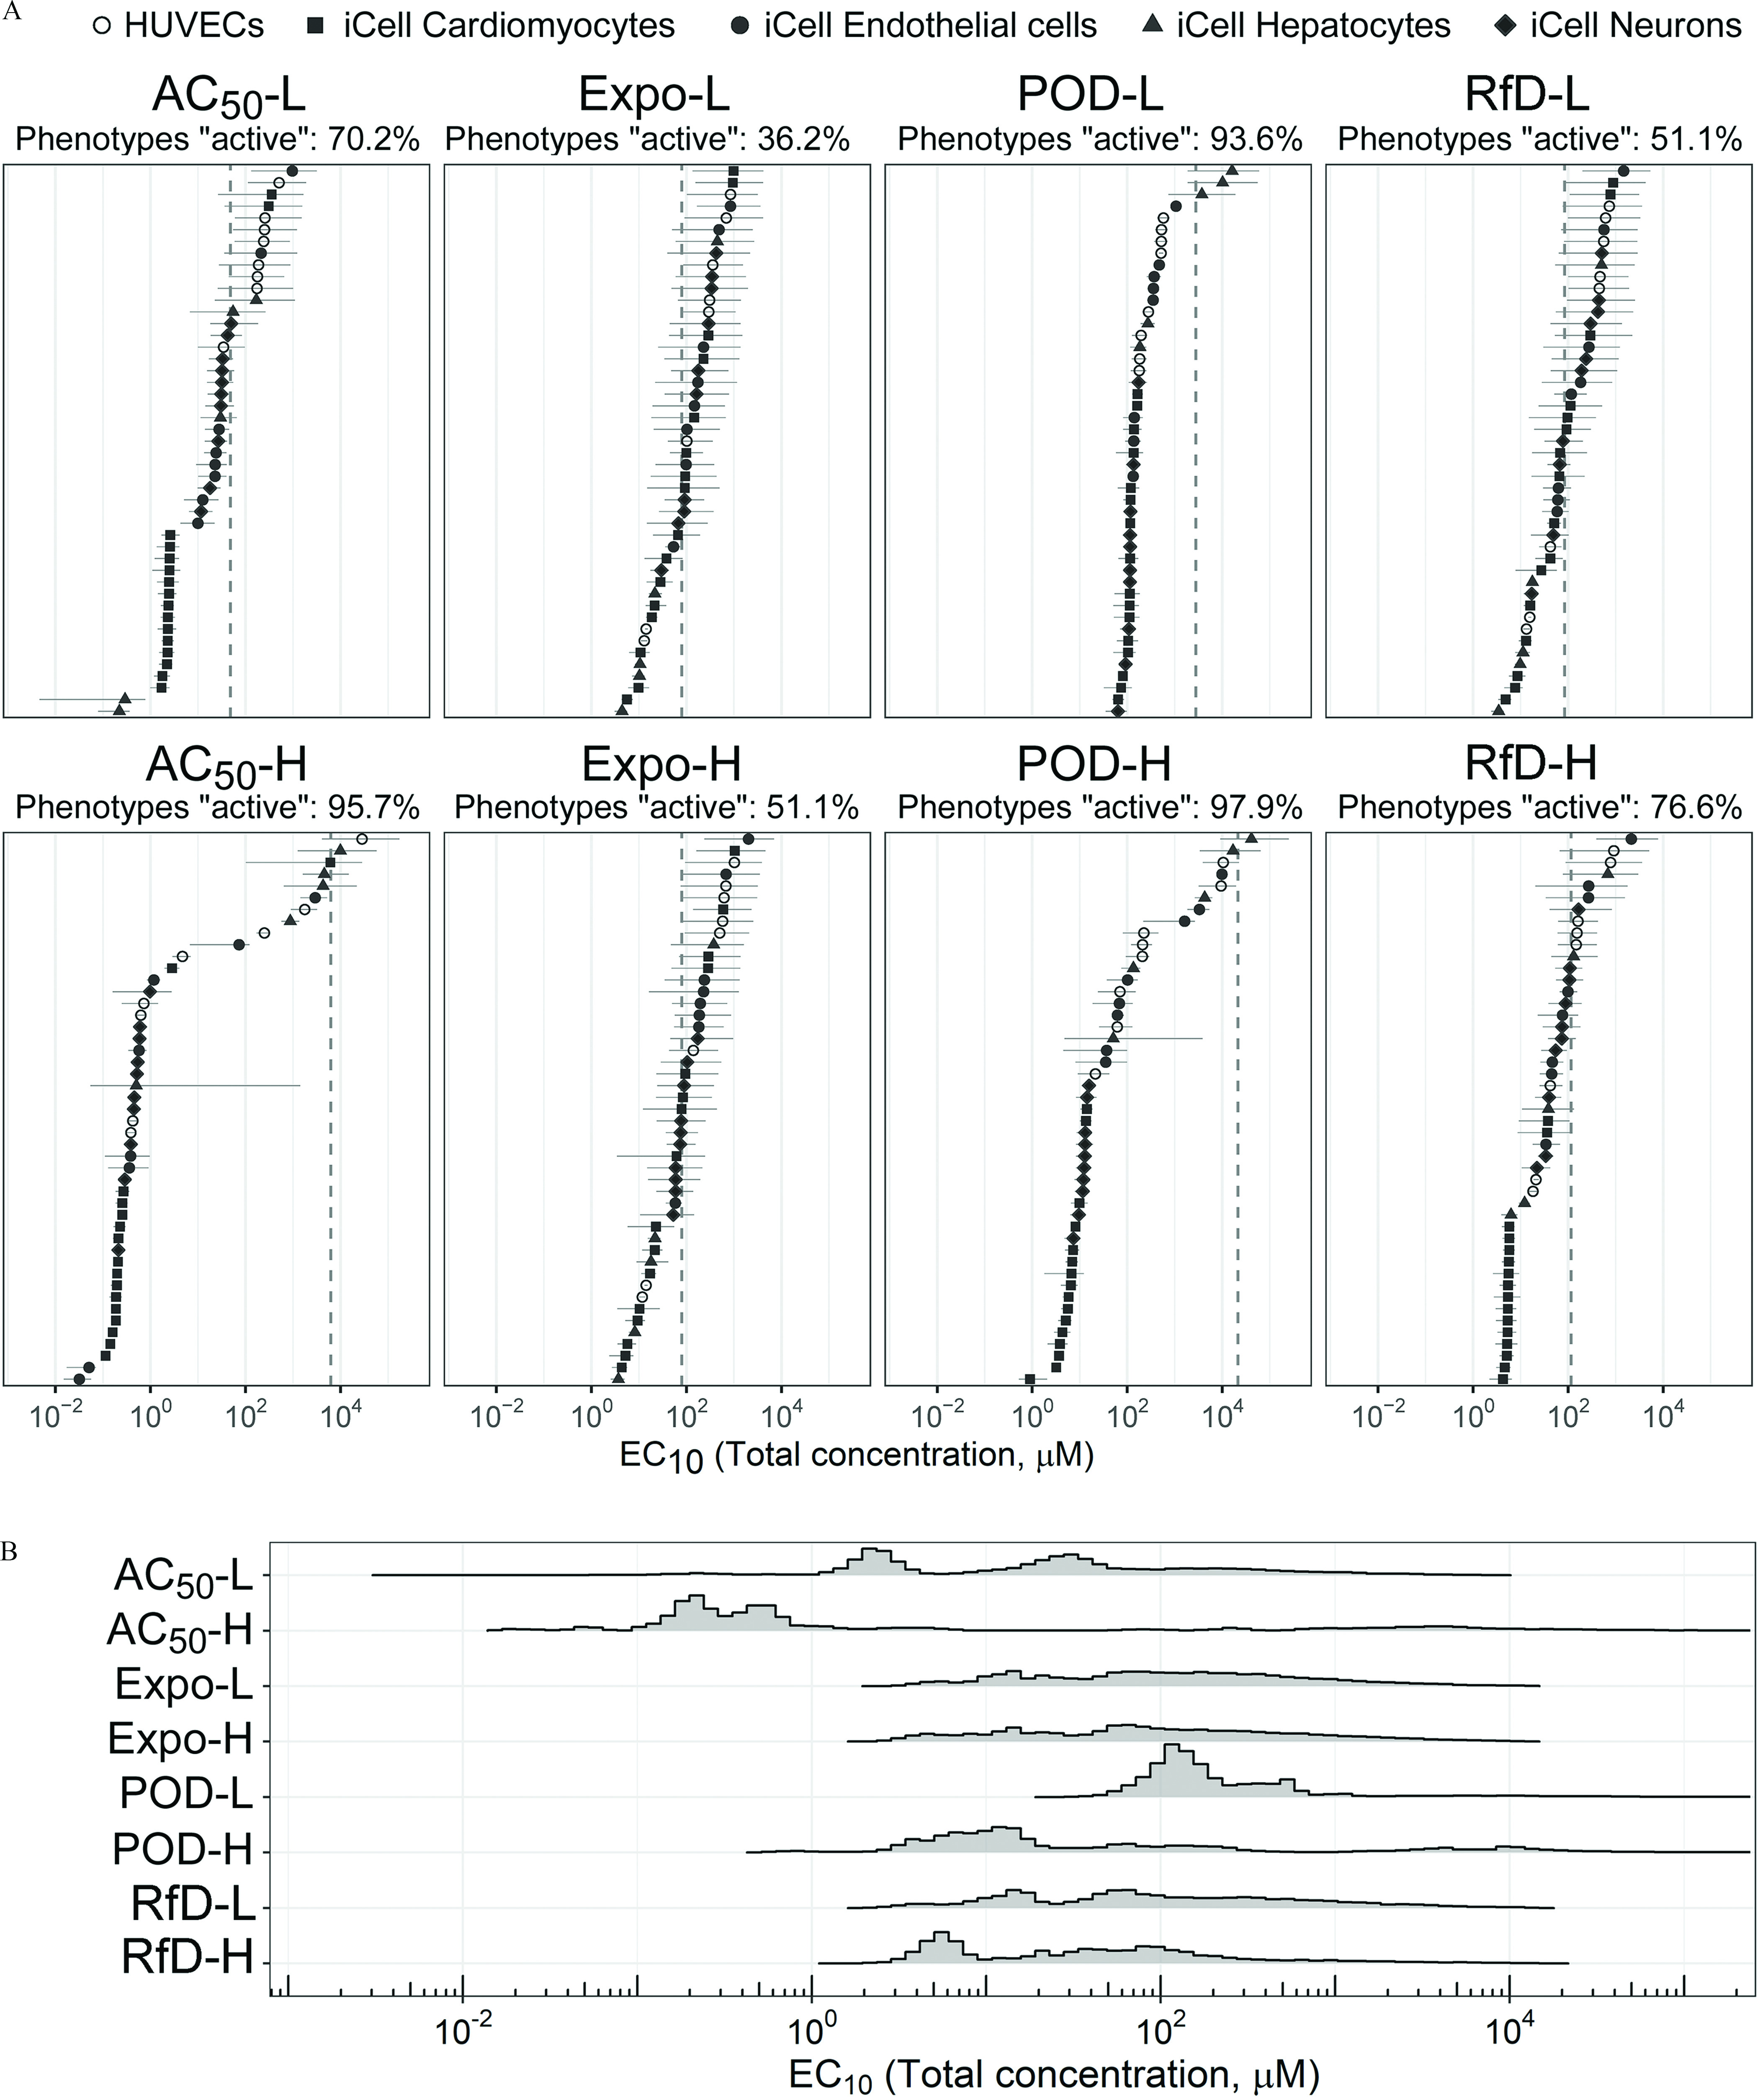
(A) The Bayesian modeling-estimated effective concentrations () (median with 90% credible interval) of the designed mixtures. The dashed vertical line is the total chemical concentration for each designed mixture. The different phenotypes in each cell type (see color legend on top of the figure) are displayed by the same color. Cyan is HUVECs, dark magenta is iCell cardiomyocytes, green is iCell endothelial cells, dark orange is iCell hepatocytes, and dark blue is iCell neurons. The percent of phenotypes active was based on the posterior median values compared with the undiluted designed concentration. (B) The probability density plot shows the distribution of all estimated for each mixture. See acronym explanations and description of the designed mixtures in Table 1. All data are included in a Supplemental Excel file.