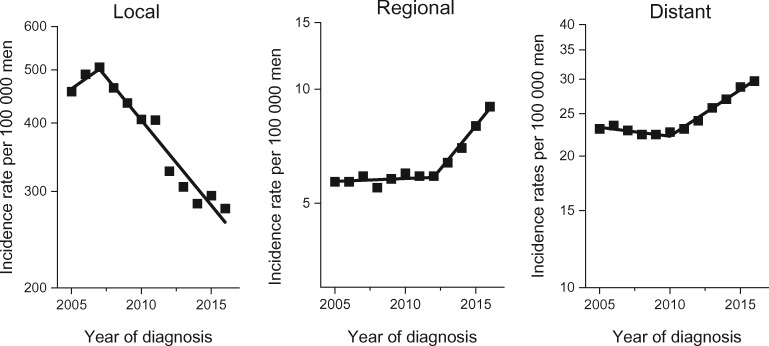
Figure 1.
Trends in annual age-standardized prostate cancer incidence rates in men aged 50 years and older in the United States by stage, 2005-2016. Solid lines represent joinpoint modeled rates, and symbols represent observed rates. Source: U.S. Cancer Statistics Public Use Research Database, November 2018 submission (2001-2016) (6).

