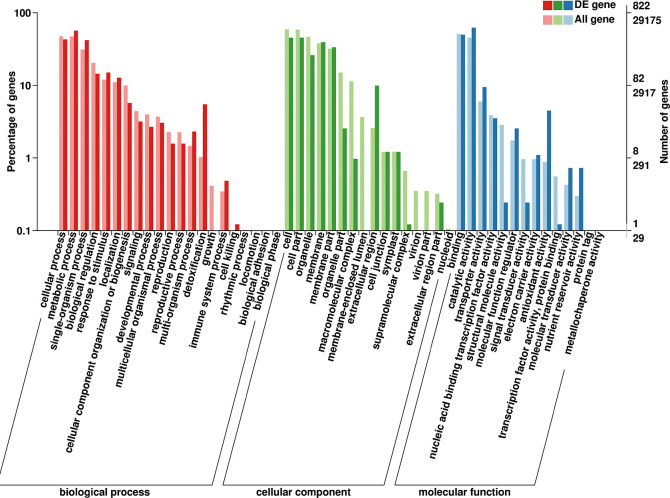
Fig 3. Gene ontology (GO) enrichment analysis of differentially expressed genes (DEGs) after exposure to graphene.
The X-axis represents the biological functions (molecular function, biological process, and cellular component) of these DEGs. The Y-axis represents the percentage or number of genes categorized into different functional pathways.

