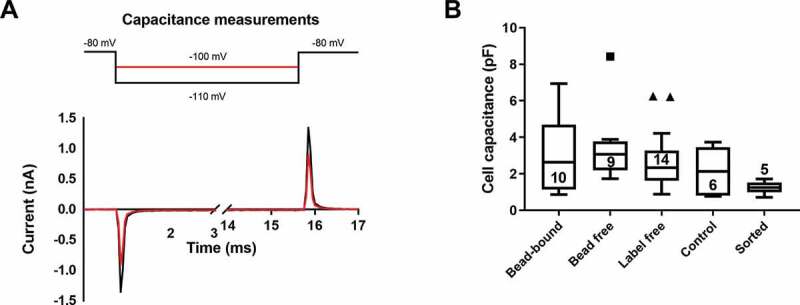
Figure 3.

Comparison of the cell membrane capacitance of separated cells
The voltage-step protocol and representative current traces for cell capacitance measurement are shown in panel A. The whole-cell patch-clamped T cell (control configuration) was hyperpolarized from −80 mV holding potential to either – 100 mV or – 110 mV test potentials (top) for 15 ms and the uncompensated capacitance charging current transients were recorded (bottom, red: – 100 mV pulse, black: – 110 mV pulse). Cell capacitance values determined for different configurations are in panel B. The data were plotted using Tukey box and whisker plot (for sample sizes indicated in the boxes) and data were compared via ANOVA-on-ranks test, no statistically significant differences were found among the groups (p > 0.05).
