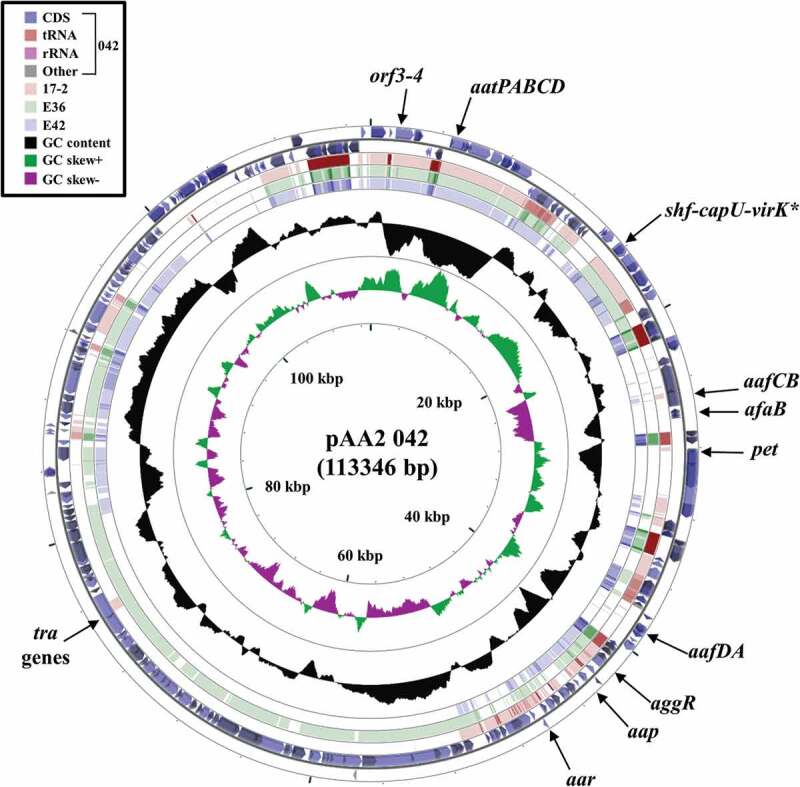
Figure 3.

Comparison of the EAEC 042 plasmid pAA2 with the genomes of EAEC strains 17–2, E36 and E42. The figure shows the comparison of the EAEC 042 pAA2 plasmid with the genomes of EAEC 17–2, E36 and E42 using GCview (http://stothard.afns.ualberta.ca/cgview_server/) [48]. The outer two rings display the genes and features of pAA2 (FN554767.1) on both strands, with selected genes labeled [67]. The brown, green and blue rings illustrate BLAST results when the genome sequences of EAEC 17–2, E36 and E42, respectively, are compared to pAA2. The inner two rings display GC content (black) and GC skew (dark green and purple) for pAA. The shf-capU-virK locus is starred as this region is found on both the EAEC 042 chromosome and pAA2 [67]
