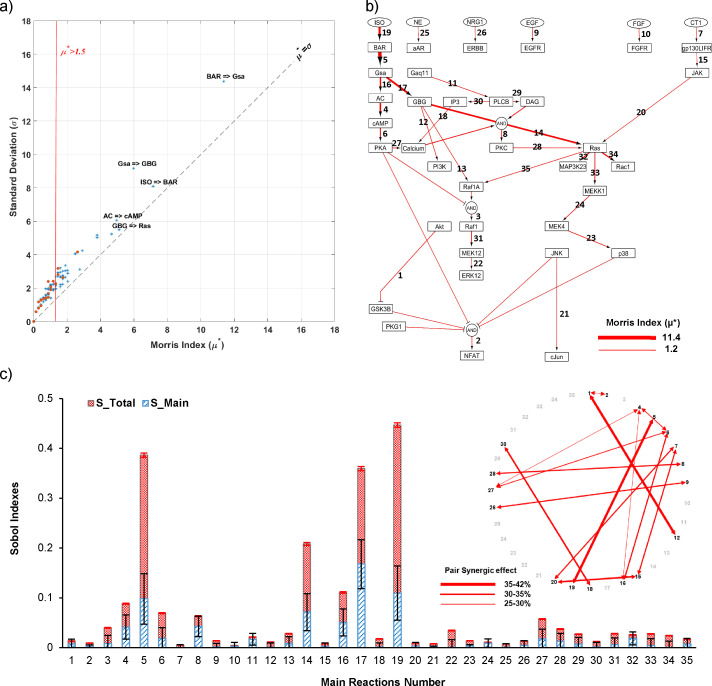
Fig 5. Two-step Global sensitivity analysis identifies key single and pair reactions in an ISO-specific context.
(A) Morris sensitivity analysis result including Morris index (μ*) and standard deviation (σ) illustrates important and non-important reactions in the ISO-specific context. Greater Morris index (μ*) demonstrates more influence on model validation percent. Larger σ to μ* ratio (above μ* = σ diagonal line) demonstrates a more nonlinear effect on model prediction accuracy which implies on more interactions with other network reactions. The orange dots and blue stars illustrate monotonic and non-monotonic effects of each reaction on model validation percent, respectively. The vertical red line indicates the significance level for identifying non-important reactions. (B) Visualization of important reactions in ISO-specific context based on their ranks from Morris sensitivity analysis. The thicker red arrows illustrate the larger Morris index (μ*). (C) Sobol sensitivity analysis reveals importance of nonlinear interactions between network signaling reactions in ISO-specific context. The Total (checked red bars) and Main (hashed blue bars) Sobol indexes and pair synergic effects are illustrated for important reactions (35/174) in ISO-specific context obtained from Morris sensitivity analysis. The error bars represent 95% confidence interval of a mean. More difference between the Total and Main indexes demonstrates a more nonlinear effect. The pair synergic effect displays the ratio of the second-order effect of each reaction pair to the sum of higher-order effects of its reactions.

