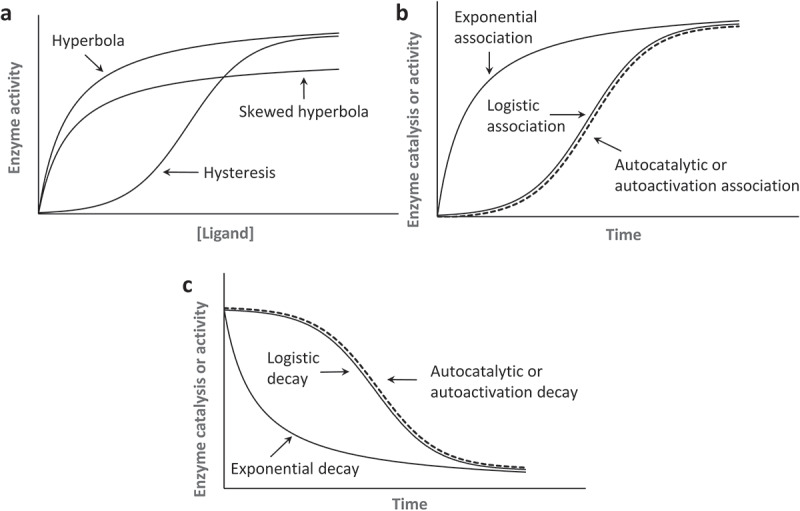
Figure 3.

Kinetic curves relevant to enzyme kinetics. (a). Hyperbolic and hysteretic saturation curvatures that are function of a ligand concentration are shown. To show the plot of the hyperbolic saturation curve, we used a one-site equilibrium binding equation of θ = [L]/(Kd + [L]) in which θ can be a fraction of the receptor protein ligand complex or enzyme activity; [L] denotes the ligand concentration; and Kd is a dissociation constant. For the hysteretic saturation curve (positive cooperativity) plot, we used the Hill equation of θ = [L]n/(Kd + [L]n) with a Hill coefficient n of 2. To show the skewed hyperbolic saturation curve (negative cooperativity) plot, we used the Hill equation of θ = [L]n/(Kd + [L]n) with a Hill coefficient n of – 2 . It is notable that when n = 1, the Hill equation essentially becomes a one-site equilibrium binding equation. When enzyme activity is directly linked to the receptor ligand binding interaction, [L] and Kd can be replaced with [S] and Km, respectively. This replacement makes θ an enzyme activity in which [S] and Km denote, respectively, the substrate concentration and a Michaelis-Menten constant. (b). Exponential, logistic, and autocatalytic or autoactivation association curvatures are shown. To illustrate the plot of the exponential and logistic association, respectively, we used the integrated rate law of γ = 1 – e−kt and γ = 1/(1 + e−kt) in which γ can be a fraction of an active enzyme, k equals a first-order rate constant, and t denotes time. For the autocatalytic or autoactivation plot, the integrated rate law of γ = 1/[1 + ([A]i/[A]a)•e−kt] was used in which [A]i and [A]a denote, respectively, the inactive and active enzyme fractions. (c). Exponential, logistic, and autocatalytic or autoactivation decay curvatures that are functions of time also are shown. For the plot of the exponential decay, we used the integrated rate law of γ = e−kt. We used the integrated rate law of γ = 1–1/(1 + e−kt) to plot logistic decay and the integrated rate law of γ = 1–1/[1 + ([A]i/[A]a)•e−kt] to plot autocatalytic or autoactivation decay. Note that the logistic and the autocatalytic or autoactivation associations are essentially the same when the ratio of the parameters [A]i and [A]a (i.e. [A]i/[A]a) is 1. The same is true for the logistic and autocatalytic decay
