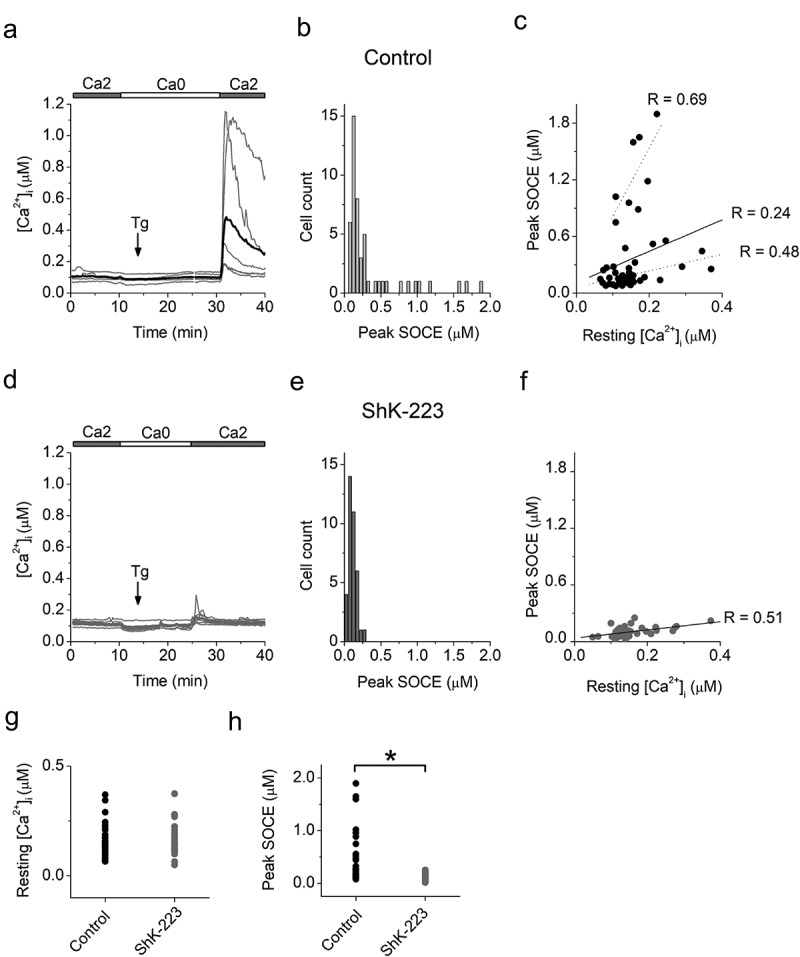
Figure 3.

The KV1.3 blocker ShK-223 reduces SOCE in LPS differentiated neonatal microglia. Primary neonatal microglia cultures were prepared from 3 independent litters and stimulated with LPS as described in our publication investigating the effect of KV1.3 blockers on P2X4 mediated Ca2+ influx in microglia [40]. Loading microglia with Fura-2 was performed as previously described [56]. Fura-2 fluorescence signals evoked by 340- and 380-nm excitation (F340 and F380, respectively) were acquired every 12 s. Data acquisition was performed using MetaFluor version 7.0 software (Molecular Devices). Estimated [Ca2+]i was calculated from background-subtracted F340/F380 ratio values and Fura-2 calibration as previously described [57]. Differences between data sets were analyzed using one-way analysis of variance (one-way ANOVA) with Bonferroni correction (Origin 7 software)
(a and d), Changes in [Ca2+]i recorded from LPS-stimulated microglia in the absence (a) or after preincubation with 100 nM ShK-223 (d). Shown are the data from one representative experiment with microglia from one neonatal culture. Grey traces are recordings from individual cells. The thick black trace and the thick red traces in (a) and (d), correspondingly, are averages of the traces from the individual cells. 2 mM Ca2+-containing (2Ca) and nominally Ca2+-free (0Ca) solutions were applied as indicated by horizontal bars; the timing of application of Tg (1 μM) is indicated with an arrow.(b and e), Distributions of the amplitudes of the [Ca2+]i transients following readdiction of extracellular Ca2+ (peak SOCE) in untreated control cells (b), and cells preincubated with ShK-223 (e). Pooled data from 4 paired experiments from 3 independent microglia preparations from 3 litters. The total number of cells is 50 in B and 37 in (e).(c and f), Relationship between peak SOCE and resting [Ca2+]i in untreated control cells (c) and cells preincubated with ShK-223 (f). Straight lines are linear regression fits of the whole set of data. The Pearson correlation coefficients (R), were 0.24 in (c) (n = 50) and 0.44 in (f) (n = 37), indicating weak and mild positive correlation, correspondingly. Deashed lines in (c) indicate linear regression fits of the data from subpopulations that include cells with amplitudes of peak SOCE above and below 600 nM. The Pearson correlation coefficients (R), were 0.69 (n = 8) for cells with peak SOCE > 600 nM and 0.48 (n = 42) for cells with peak SOCE < 600 nm, indicating strong and mild positive correlation, respectively. (c and f), pooled data from 4 experiments from 3 independent microglia preparations from 3 litters. n, number of cells.(g), Resting [Ca2+]i in control cells (black dots, n = 50) and cells preincubated with ShK-223 (red dots, n = 37).(h), Peak SOCE in control cells (black dots, n = 50) and cells preincubated with ShK-223 (red dots, n = 37). Star indicates that the difference between groups is significant at 0.05 level (one-way ANOVA with Bonferroni correction, α = 0.0083). (g) and (h) show pooled data from 4 paired experiments on cells isolated from 3 independent microglia preparations from 3 litters. n, number of cells.
