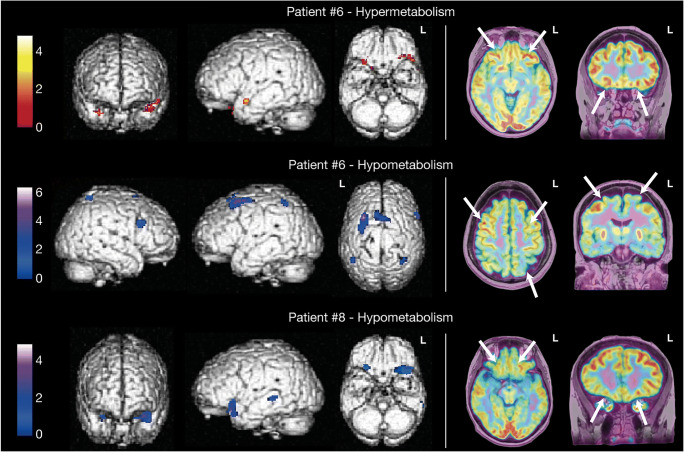
Fig. 2.
Left: regional hyper- (red to white color scale) and hypo- (blue to white color scale) metabolism in two typical patients rendered on a 3D canonical brain. Images are thresholded at p < .001 uncorrected (k ≥ 50 voxels). Right: native FDG-PET images co-registered on the patients’ 3D T1 MRI sequence. White arrows point towards the brain areas showing significant metabolic changes at the uncorrected statistical threshold illustrated on the left part of the figure

