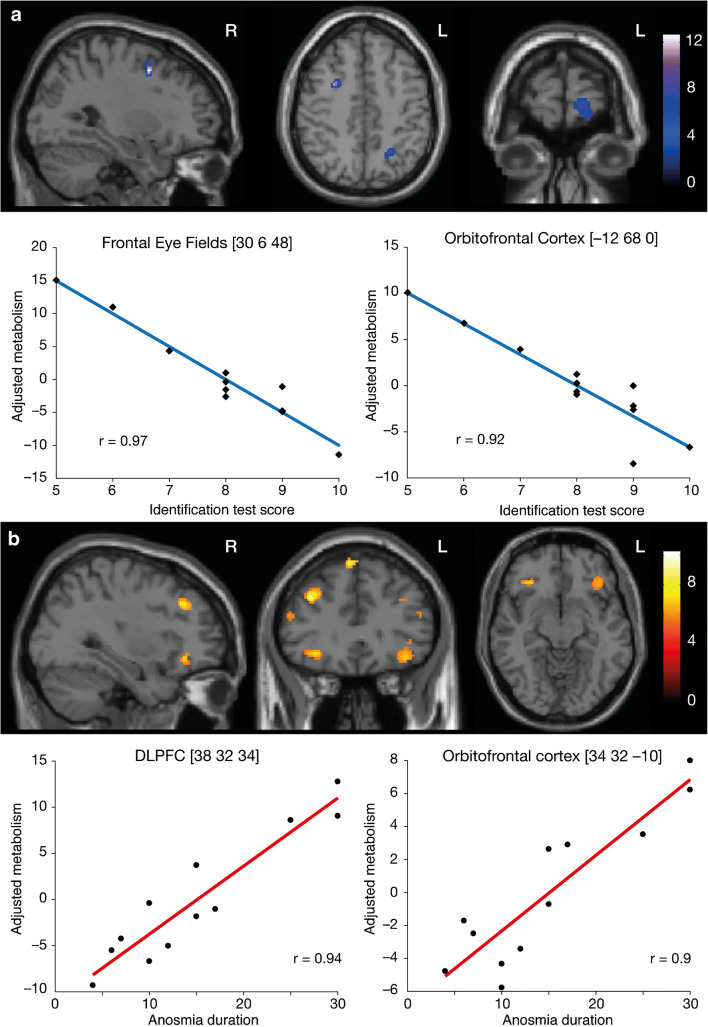
Fig. 4.
Results of the correlation analyses performed between the cerebral glucose metabolism and the severity of olfactory dysfunction and between the cerebral glucose metabolism and the duration of anosmia. (a) Regression plots of the severity of olfactory dysfunction assessed by the identification test score (Top) and adjusted metabolic responses obtained by considering the peak voxel in the right FEF ([30 6 48], Pearson’s correlation: r = 0.97, p < .001) and in the left orbitofrontal cortex ([− 12 68 0], Pearson’s correlation: r = 0.94, p < .001). (b) Regression plots of the duration of anosmia (Bottom) and adjusted metabolic responses obtained by considering the peak voxel in the right DLPFC ([38 32 34], Pearson’s correlation: r = 0.94, p < .001) and in the right orbitofrontal cortex ([34 32 − 10], Pearson’s correlation: r = 0.9, p < .001)

