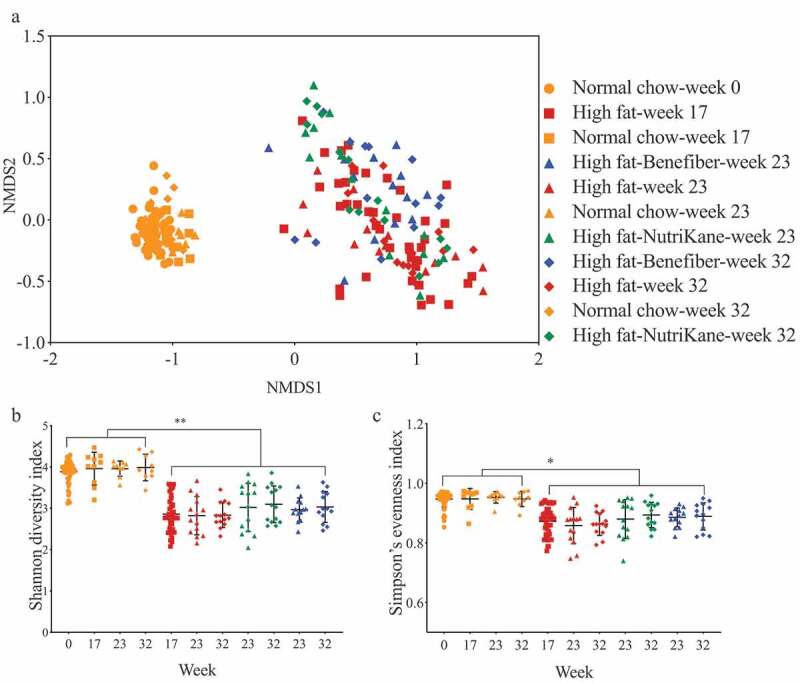
Figure 1.

Ordination and alpha diversity of the gut microbiota. Data shown for mice fed each of the four diets at weeks 0, 17, 23 and 32. (a) Ordination of the gut microbiota shown as a Bray-Curtis similarity-based nMDS plot. Gut microbial diversity and evenness shown as (b) Shannon diversity and (c) Simpson’s evenness indices, respectively. Mean values with ± SD are shown (** P < .01, * P < .05).
