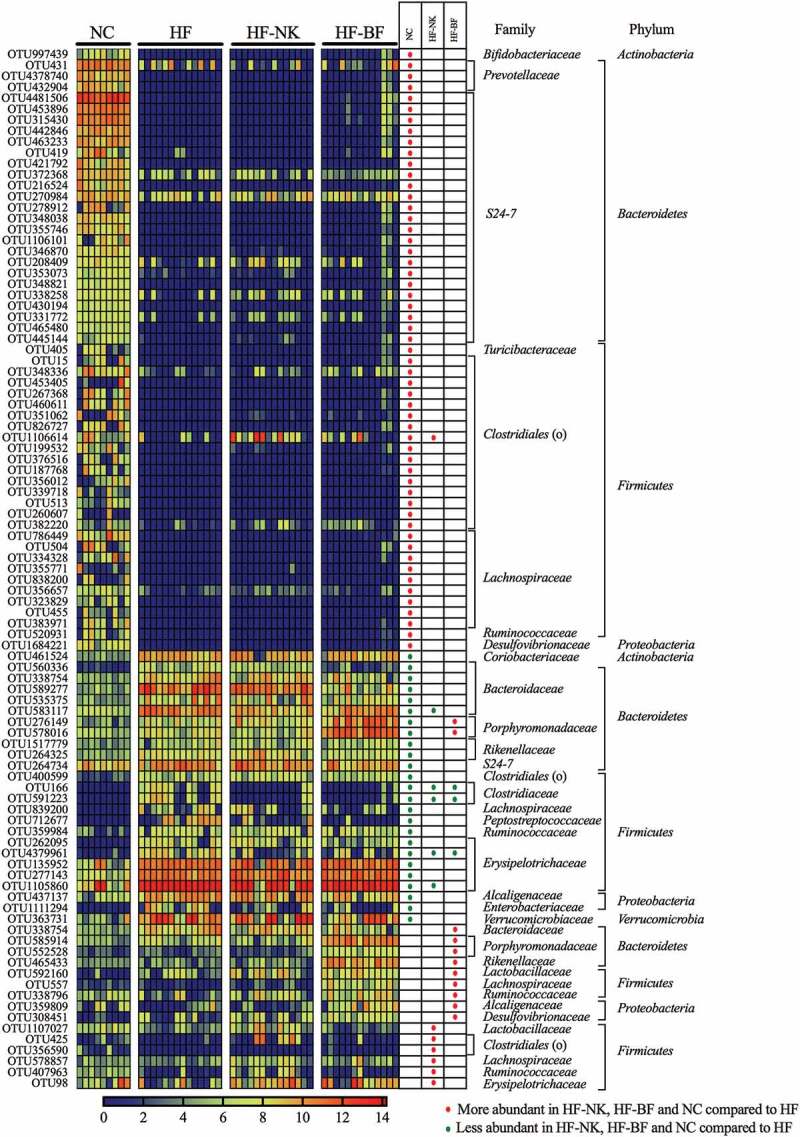
Figure 2.

The relative abundance (Log10 transformed) of the OTUs that were significantly different between dietary groups (NC-normal chow, HF-high fat diet, HF-NK-high fat diet modified with NutriKane and HF-BF-high fat diet modified with Benefiber). The abundance of OTUs are shown per mouse. Differentially abundant OTUs were determined through LEfSe analyses between HF vs NC, HF vs HF-NK and HF vs HF-BF groups. Rows in the unpaired heatmap correspond to the abundance of the OTUs and columns correspond to individual mice in each dietary group. Red and blue denote the highest and lowest relative abundance, respectively, as shown in the legend. The changing direction of the relative abundance of the OTUs in comparison to the HF group is shown in the table, red and green dots denote more and less abundant compared to the HF group, respectively. The taxonomy of the OTUs (family and phylum) are shown on the right. The relative abundance of the these OTUs per mouse is provided in Table S3.
