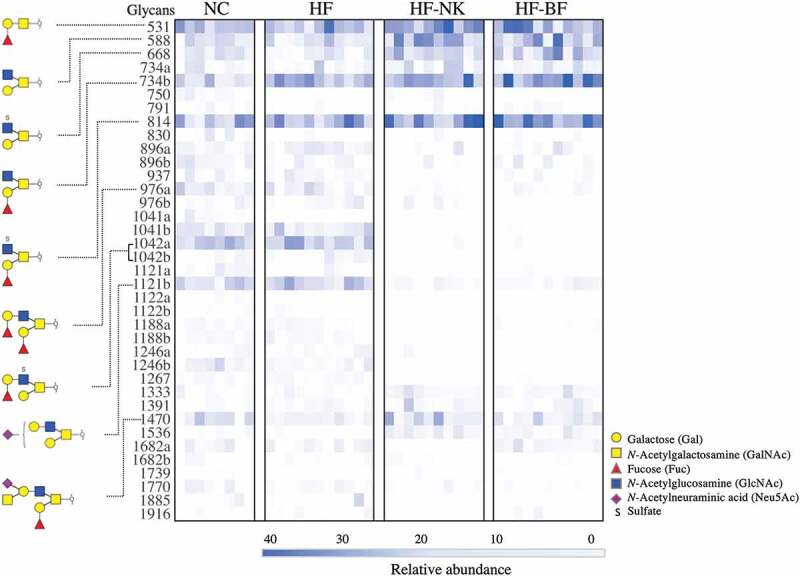
Figure 3.

Unpaired heatmap illustrating the relative abundance of O-linked glycans. Glycans were released from the colonic mucin of mice given a normal chow (NC), high fat diet (HF), high fat diet modified with NutriKane (HF-NK), or high fat diet modified with Benefiber (HF-BF) diet. Glycans are listed in rows by their neutral molecular mass with structural isomers distinguished alphabetically. Each column represents a single mouse. Glycans with relative abundance significantly different between diets are presented on the left.
