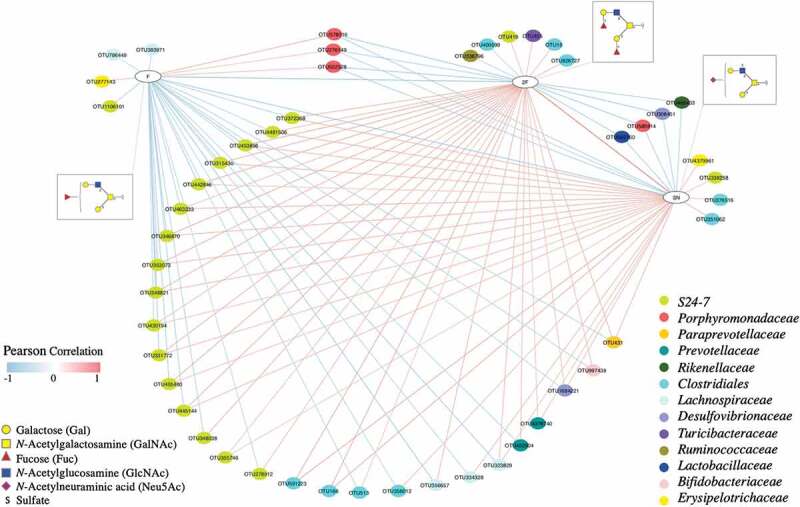
Figure 5.

Network showing correlations between the relative abundance of bacterial OTUs and colonic mucin glycans. A pairwise Pearson correlation analysis was conducted between the relative abundance of OTUs and relative abundance of glycan groups. OTUs and glycan groups with significantly different abundances between dietary groups were included in the analysis. Only significant correlations (P < .05) were used to construct the network. Glycans are grouped based on the type and number of specific terminal structures: F- Fuc, 2F- double Fuc and SN- sulfate and Neu5Ac. The OTUs are shown in color-coded dots based on the bacterial family. A positive and negative correlation is presented by a red and blue line, respectively. The intensity of the color denotes the strength of the correlation.
