Figure 2.

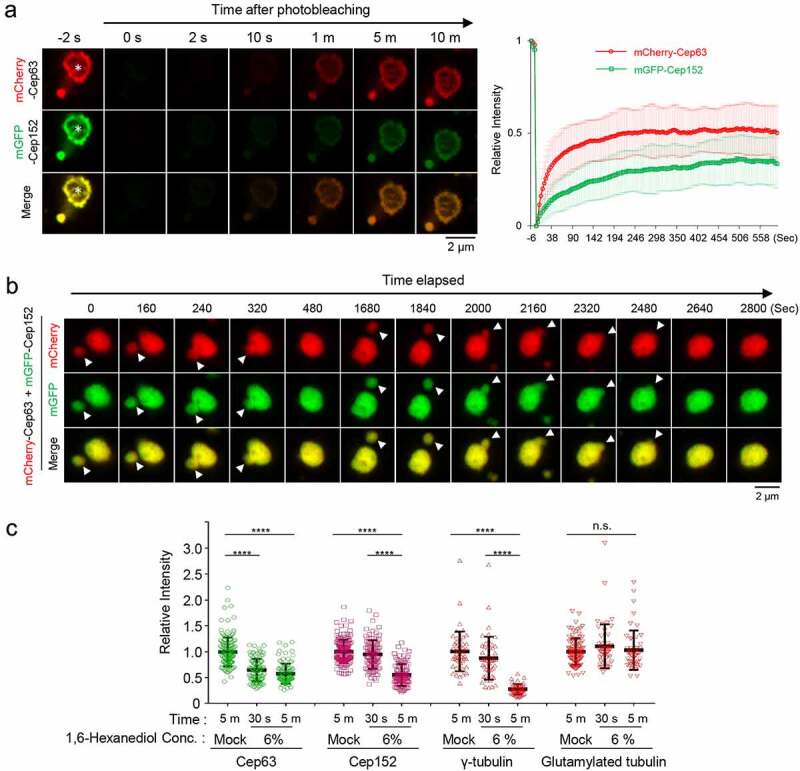
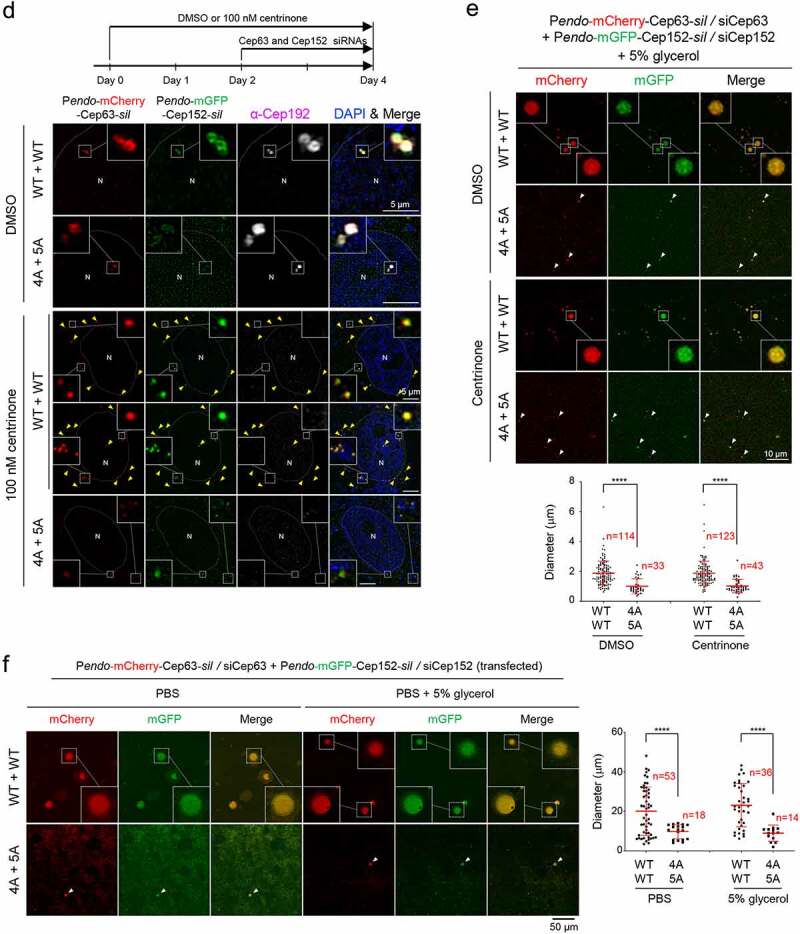
Phase-separating activity of Cep63 and Cep152 in vivo. (a), FRAP analysis of adenovirus-expressed mCherry-Cep63 and mGFP-Cep152 aggregates generated in HEK293 cells. Images were acquired for 600 seconds at 2-second intervals. Representative confocal images acquired at the indicated time points are provided. Quantified relative signal intensities are shown in mean ± s.d. (n = 8 independent aggregates). (b), Time-lapse imaging showing the fusion of adenovirus-expressed mCherry-Cep63 and mGFP-Cep152 aggregates formed in U2OS cells. Images were acquired at 40-second intervals. The image at each time point was generated by projecting all z-stacks (greater than 21 stacks, 300-nm intervals). White arrowheads indicate two small condensate-like aggregates, which fuse into the bigger condensate-like aggregate (the middle sphere). Representative images are shown. Six out of 6 independent time-lapse experiments showed more than one fusion event during the course of experiment. (c), Quantification of confocal images for immunostained U2OS cells treated with either culture medium (mock) or 6% 1,6-hexanediol for the indicated lengths of time. Representative images are provided in Fig S2A. Relative fluorescence intensities for endogenous Cep63, Cep152, γ-tubulin, and glutamylated tubulin signals are shown in mean ± s.d. (n ≥ 50 cells/sample obtained from two independent experiments). ****, P < 0.0001 (one-way ANOVA). (d), 3D-SIM analyses for immunostained U2OS cells stably expressing endogenous promoter (Pendo)–controlled mCherry-Cep63-sil (WT or 4A) and mGFP-Cep152-sil (WT or 5A) and treated with centrinone and siRNAs for Cep63 and Cep152 (see the schematic diagram). Cep192, a centriole marker. N, nucleus. Arrowheads, nanoscale mCherry-Cep63•mGFP-Cep152 aggregates detected in cytosol after centrinone treatment. Note a greatly reduced number of aggregates in the 4A + 5A cells. (e), The cells in (d) were lysed in PBS and incubated in the presence of 5% glycerol. The resulting samples were subjected to confocal imaging and quantification. The total number of condensates (weak condensates in the 4A + 5A sample were marked by arrowheads) observed from seven randomly chosen fields for each group is provided, and the data are shown in mean ± s. d. (f), Confocal imaging and quantification of samples prepared from U2OS cell lysates transfected (to express in multiple copies) with Pendo-mCherry-Cep63-sil and Pendo-mGFP-Cep152-sil under Cep63 and Cep152 RNAi conditions. The lysates were incubated in PBS or PBS + 5% glycerol. The total number of condensates (arrowheads) observed from twelve randomly chosen fields for each sample is provided and the data are shown in mean ± s. d. Arrowhead, a small condensate observed in the 4A + 5A mutant sample
Figure 2.

(Continued)
