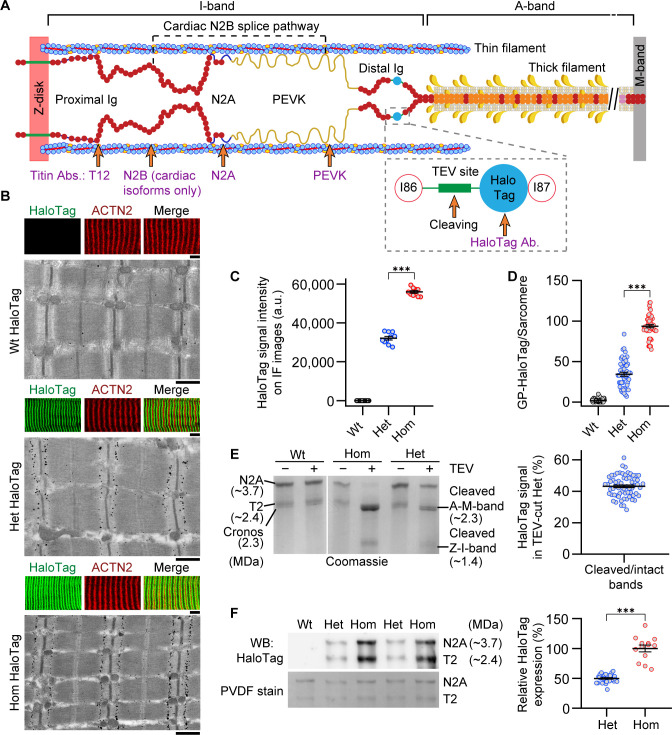
Figure 1. Mutant titin expression in skeletal muscles of different genotypes.
(A) Schematic of titin cleavage (TC) mouse half-sarcomere. Distal I-band titin holds a tobacco etch virus (TEV) protease-recognition site and a HaloTag. The epitope positions of titin and HaloTag antibodies are indicated. (B) Correlative immunofluorescence (IF) and immunogold electron microscopy of wild-type (Wt), heterozygous (Het), and homozygous (Hom) psoas muscle. Representative IF images of fibers (colored panels) labeled with HaloTag antibody (green) and counterstained for α-actinin (ACTN2, red), and immunoelectron micrograph showing HaloTag labeling. Scale bars, 5 μm (IF); 1 μm (IEM). (C) Quantification of HaloTag-expression level using IF intensities (HaloTag signals normalized to ACTN2 signals; n = 10 fiber averages; sarcomere length [SL] range, 2.7–2.9 µm). (D) Gold particle (GP) count per sarcomere, from HaloTag-stained IEM images (n = 50 sarcomeres/group; SL range, 2.7–2.9 µm). (E) Coomassie-stained, agarose-strengthened 1.8% sodium dodecyl sulfate–polyacrylamide gel electrophoresis (SDS–PAGE), titin gel analysis in different genotypes. Left: Representative gel with bands labeled. Right: Results of densitometric quantification of cleaved titin (A-M-band) intensity, compared to non-cleaved titin in Het (n = 65 samples; n = 5 different mice/group). (F) Western blot analysis of mutant titin (N2A) expression in different genotypes. Left: Representative immunoblot using anti-HaloTag (top) and Coomassie-stained PVDF membrane indicating protein load (bottom). Right: Densitometric results for Het vs. Hom anti-HaloTag signal intensities (n = 29 Het, 13 Hom). Stats: ANOVA with Tukey’s HSD post hoc procedure or Student’s t-test.

