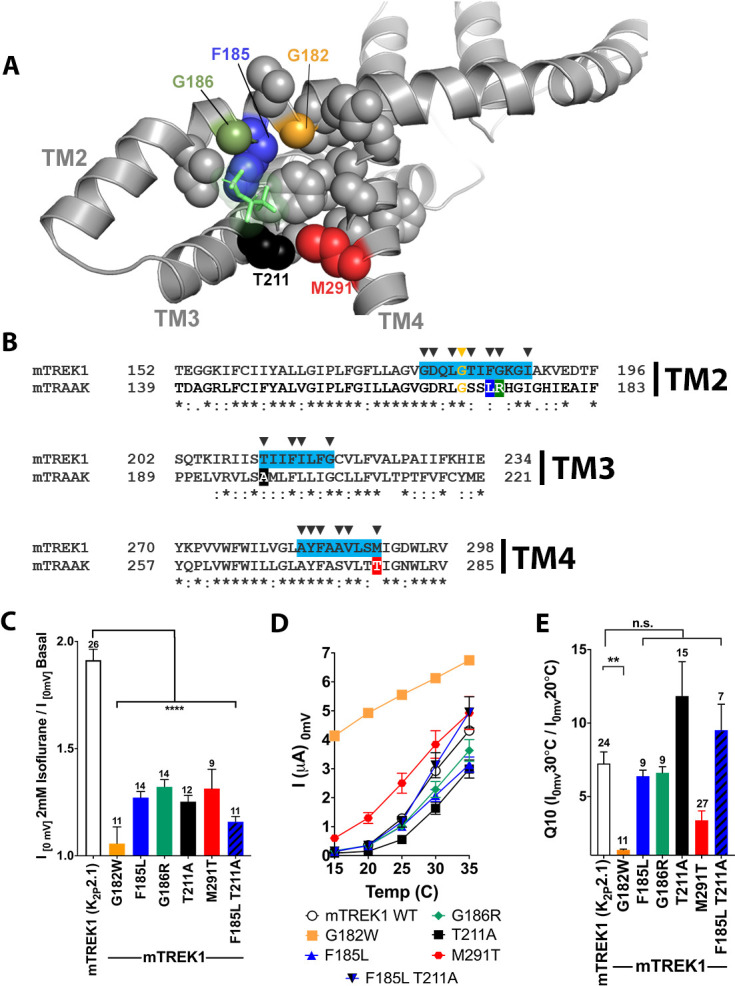
Figure 7. Mutations in the isoflurane-binding site alter anesthetic sensitivity without perturbing global channel function.
(A) Representative MD) snapshot showing the isoflurane-binding site, including residues predicted to have >20% occupancy by isoflurane shown in sphere representation and isoflurane shown in stick representation (lime). (B) Alignments of mouse TREK1 and TRAAK sequences, with the isoflurane-binding domain regions of TREK1 TM2, TM3, and TM4 (as identified by MD simulation) highlighted in blue. Arrows denote positions of high isoflurane occupancy. Poorly conserved residues are color coded throughout the figure [F185 (blue), G186 (green), T211 (red), and M291 (black)]. (C) Quantification of TREK1 wildtype and mutant responses to 2 mM isoflurane administration, (D) temperature, as measured by TREK1 current at 0 mV, or (E) temperature dependence as measured by Q10 (30°C/20°C). Number of replicate experiments indicated. Error bars are mean ± SEM. Statistically significance was determined by one-way ANOVA combined with a Dunnetts multiple comparison test against mTREK1 WT data, results indicated, **p<0.05,****p<0.0005.


