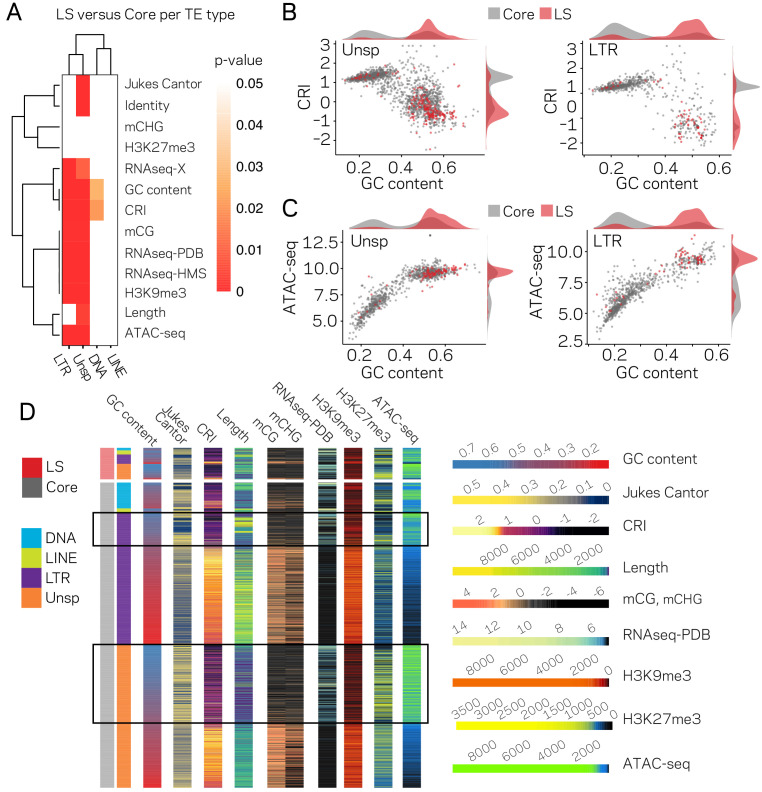
Figure 3. The LTR and Unspecified elements have significantly different chromatin profiles based on core versus LS location.
(A) Heatmap comparing core versus LS values within the four TE classifications for the variable listed to the right. Plot colored based on p-values from Wilcoxon rank sum test. p-values≥0.05 are colored white going to red for p-value ≅ 0. (B) Scatter and density plots similar to those shown in Figure 2c except the individual TE points are colored by core (gray) versus LS (red) location. The density plots are also constructed based on the two groupings (C) Similar to B, with the y-axis now showing the log2 (TPM+1) values from ATAC-seq (D) Multiple grouped heatmaps for ten variables collected for each TE. Each row represents a single element and the same ordering is used across all plots. The LS elements are grouped at the top, indicated by the red bar at the top left, and the core elements are grouped below, indicated by the gray bar at the left. Elements are further grouped by the four classifications indicated by the color code shown to the left. Within each element group, the elements are ordered by descending GC content. The scale for each heatmap is shown at the right. GC content, fraction of GC in sequence; Jukes Cantor, corrected distance as proxy of TE age; CRI, Composite RIP index; Length, element length; mCG and mCHG, log2(weighted cytosine DNA methylation+0.01) for CG and CHG, respectively; RNAseq-PDB, variance stabilizing transformed log2 RNA-sequencing reads from PDB grown fungus; H3K9me3 and H3K27me3 and ATAC-seq, TPM values of mapped reads H3K9me3 ChIP-seq, H3K27me3 ChIP-seq, or Assay for transposase accessible chromatin, respectively. Black boxes highlight LTR and Unsp elements in the core that have euchromatin profiles.


