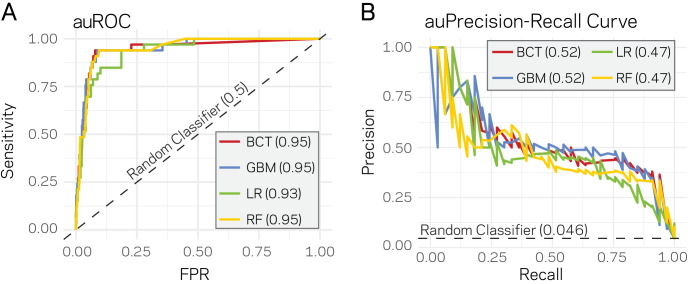
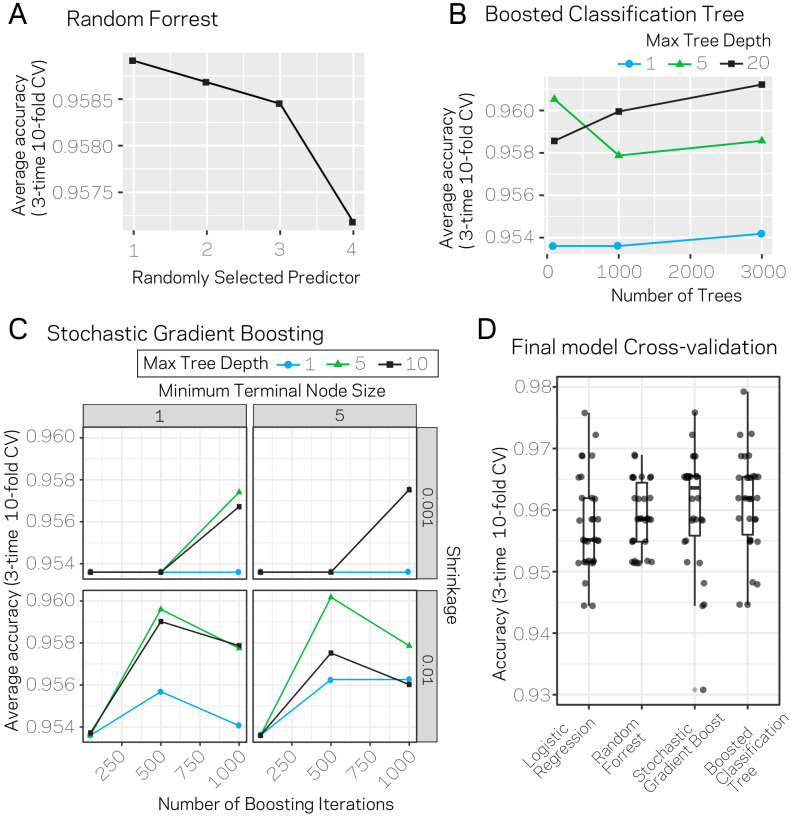
Figure 5. Supervised machine learning can predict Lineage-Specific (LS) regions based on epigenome and physical genome characteristics.
(A) Area under the Response operator curve (auROC) plotting sensitivity and false positive rate (FPR) for four machine learning algorithms, BCT- Boosted classification tree; GBM- stochastic gradient boosting; LR- logistic regression; RF- random forest. The auROC scores are shown next the algorithm key in the gray box. The black dotted line represents the performance of a random classifier. Perfect model performance would be a curve through point (0,1) in the upper left corner. (B) Area under the Precision-Recall curve for the same four models shown in A. Area under the curves are shown in the figure key in the gray box. The black dashed line shows the performance of a random classifier, calculated as the TP / (TP + FN). Perfect model performance would be a curve through point (1,1) in the upper right corner.


