. 2020 Dec 18;9:e62208. doi: 10.7554/eLife.62208

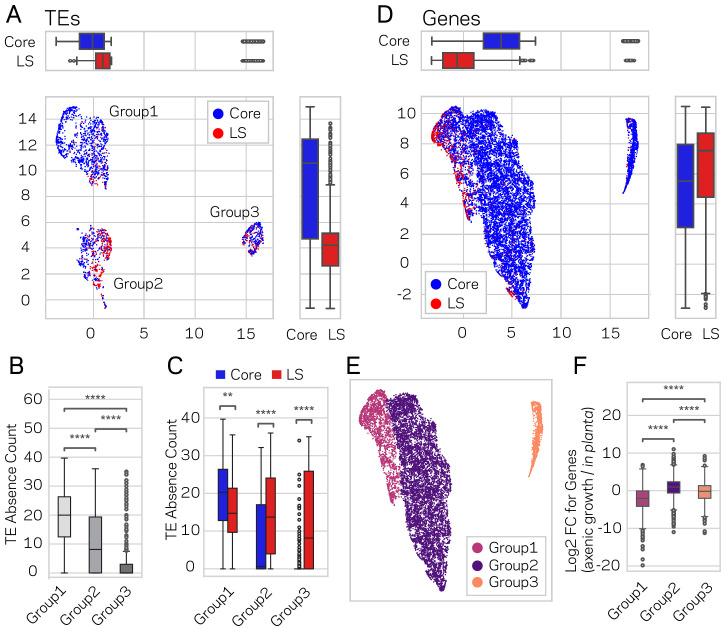
Figure 7. Genome-wide UMAP groups details that functional elements labeled core and LS have different epigenetic and DNA characteristics.

(A) Uniform Manifold Approximation and Projection (UMAP) clustering of individual V. dahliae TEs, color coded for core (blue) and LS (red). UMAP clustering in two dimensions resulted in the identification Group1, 2, and 3 elements. Boxplots are shown opposite of the x- and y-axis to quantify the UMAP designation of the LS and core elements. Statistical difference measured using Mann-Whitney U test for UMAP labeling on the x-axis, p-value=1.77e-38, and y-axis, p-value=9.04e-80. (B) Boxplot for TE absence counts for UMAP Group1, 2, and 3 elements. Statistical difference measured using Conover’s test and Holm multiple-test correction of p-values (C) Boxplot for TE absence counts for LS and core elements in UMAP Group1, 2, and 3. Statistical difference measured using Mann-Whitney U test and Holm multiple-test correction of p-values. (D) Similar UMAP clustering as shown in (A), but performed using genes as the clustering elements shown as individual dots. Marginal boxplots shown as in (A), x-axis p-value=5.45e-221, and y-axis p-value=1.84e-28. (E) UMAP gene clustering, color coded to show three groups. (F) Boxplot for in planta gene induction for UMAP Group1, 2, and 3 genes. Statistical difference measured using Conover’s test and Holm multiple-test correction of p-values. **, p-value<0.01; ****, p-value<0.0001.

Figure 7—source data 1. Genomic data and UMAP group for TEs.
Figure 7—source data 2. Genomic data and UMAP group for genes.

Figure 7.

Figure 7—figure supplement 1. Multiple comparisons of transposable elements (TEs) in UMAP groups for genomic variables.
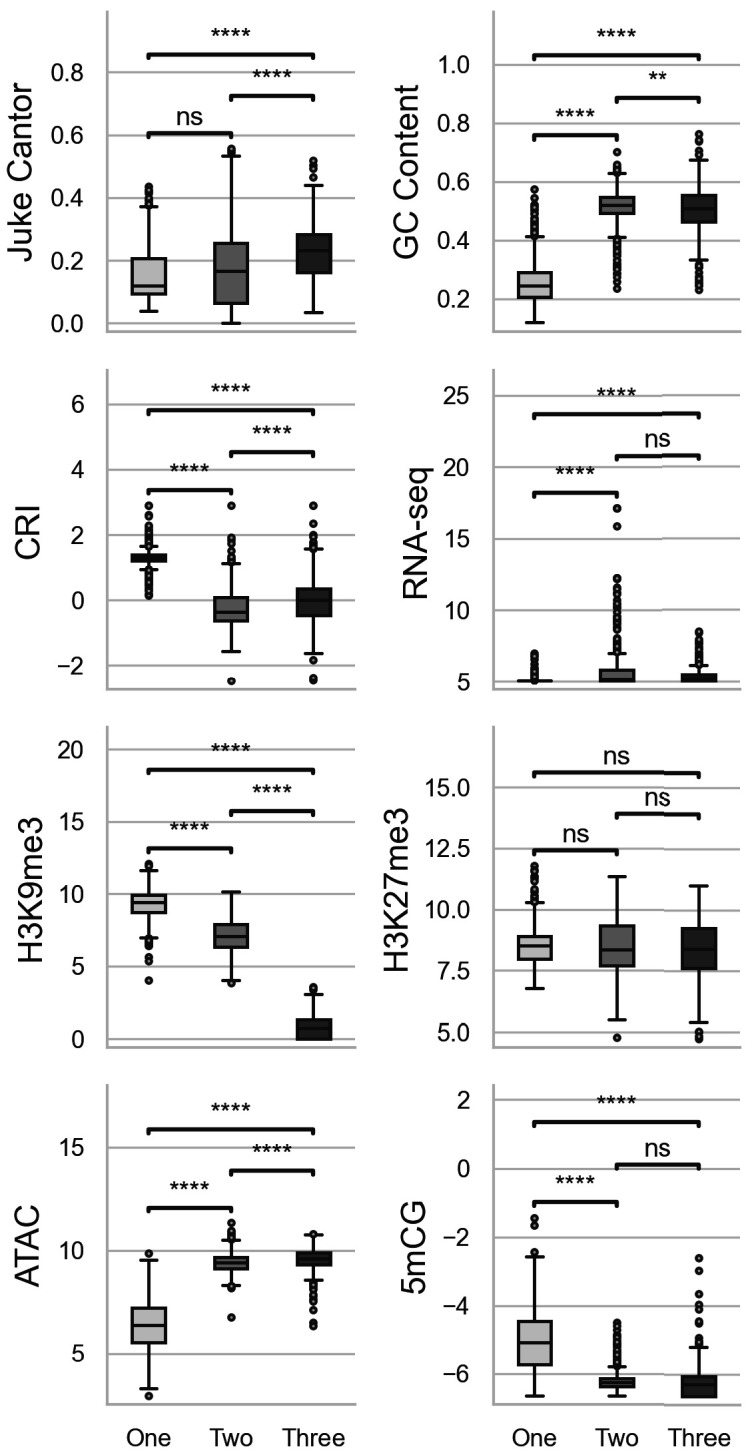
Figure 7—figure supplement 1.

GC content, GC sequence fraction; Jukes Cantor, corrected Jukes Cantor distance of TE comparisons; CRI, Composite RIP index; RNAseq, variance stabilizing transformed log2 RNA-sequencing reads from Xylem-media grown fungus; H3K9me3 and H3K27me3 and ATAC-seq, TPM values of mapped reads from H3K9me3 ChIP-seq, H3K27me3 ChIP-seq, or Assay for transposase accessible chromatin respectively; 5mCG, log2 weighted cytosine DNA methylation+0.01 for CG. Pairwise comparisons were performed using Conover’s test, with Holm multiple testing correction. **, p-value<0.01; ****, p-value<0.0001.ns, Non-significant p-value at a = 0.05.
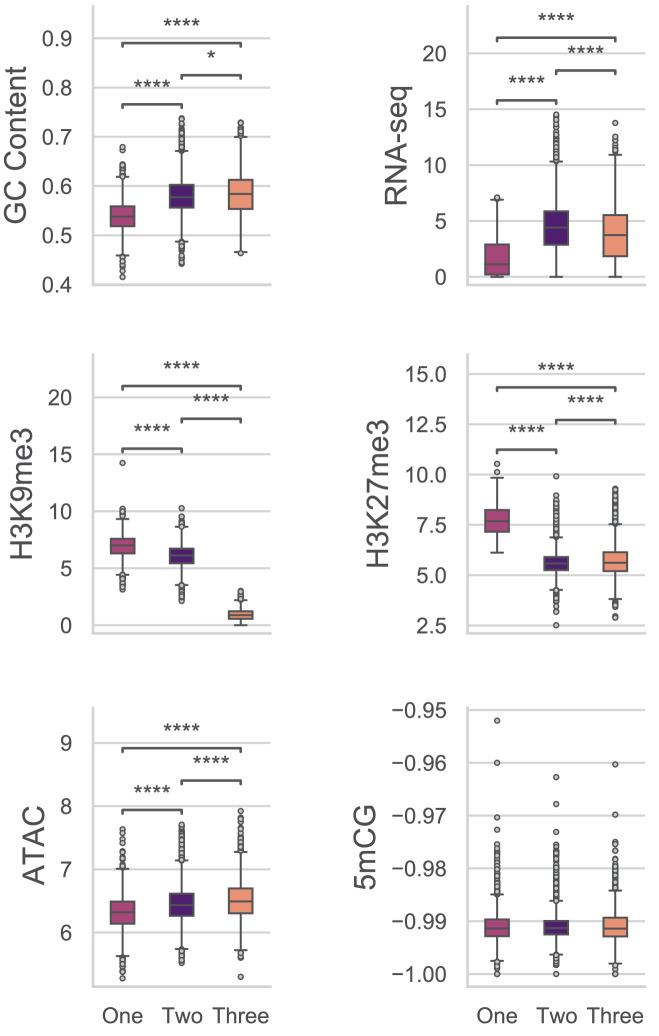
Figure 7—figure supplement 2. Multiple comparisons of Genes in UMAP groups for genomic variables.

Figure 7—figure supplement 2.

GC content, GC sequence fraction; RNAseq, log2 TPM+1 of RNA-sequencing reads from PDB grown fungus; H3K9me3 and H3K27me3 and ATAC-seq, TPM values of mapped reads from H3K9me3 ChIP-seq, H3K27me3 ChIP-seq, or Assay for transposase accessible chromatin respectively; 5mCG, log2 weighted cytosine DNA methylation+0.01 for CG. There were no significant differences for the comparisons of DNA methylation levels at a = 0.05. Pairwise comparisons were performed using Conover’s test, with Holm multiple testing correction. *, p-value<0.05; ****, p-value<0.0001.
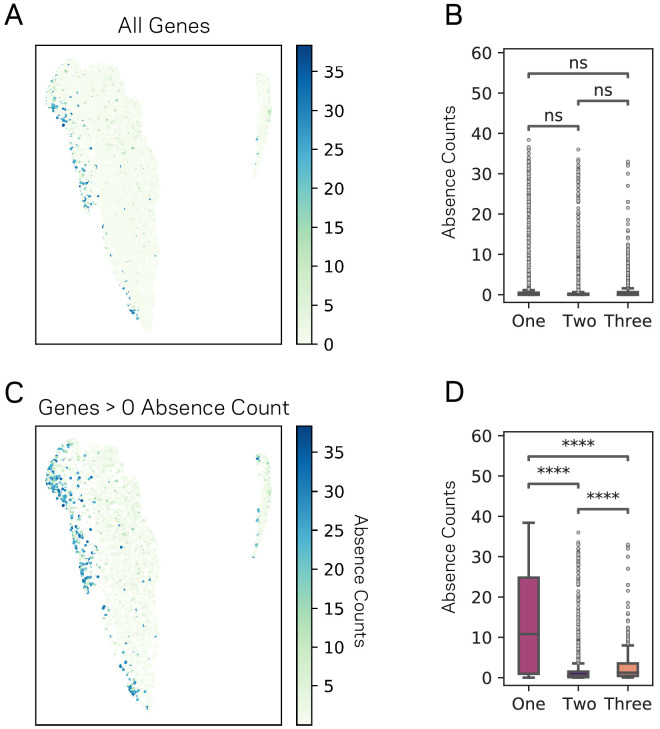
Figure 7—figure supplement 3. UMAP groupings vary significantly for Absence across V.

Figure 7—figure supplement 3.

dahliae strain. (A) Scatter plot showing each 11,429 genes as a point following the UMAP results. Each gene is colored according to its absence count across 42 V. dahliae strains. (B) Box plot showing the distribution of gene absence counts for each of the three UMAP groups. (C) Similar plot as shown in A, but only genes that have an absence count greater than zero are plotted. (D) Similar to B, but only genes that have an absence count greater than zero are plotted. Pairwise comparisons were performed using Conover’s test, with Holm multiple testing correction. There were 2130, 8140, and 1159 genes in UMAP Group1, 2, and 3 respectively for A and B. There were 666, 3156 and 441 genes in UMAP Group1, 2, and 3 respectively for C and D. ns, non-significant a = 0.05; ****, p-value<0.0001.