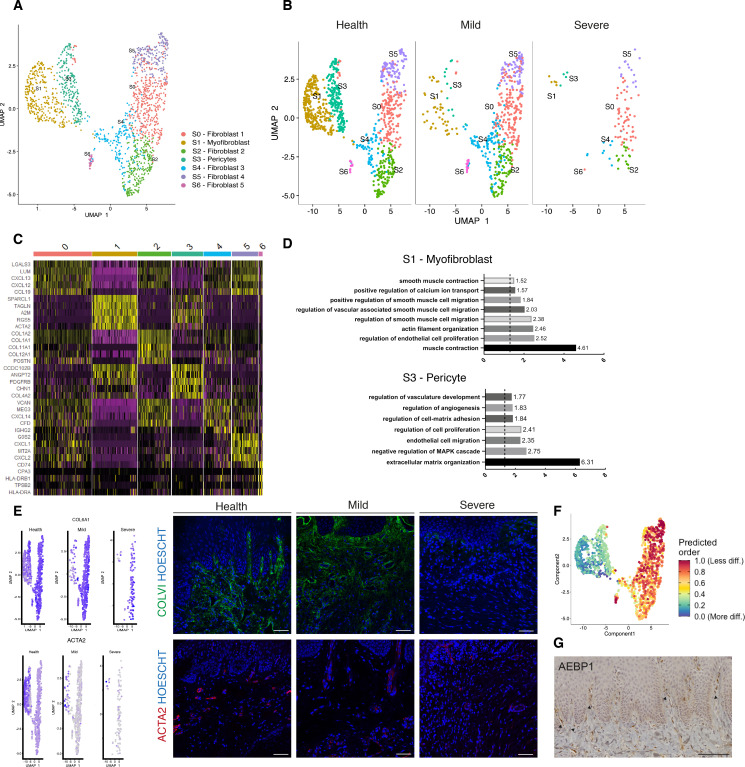
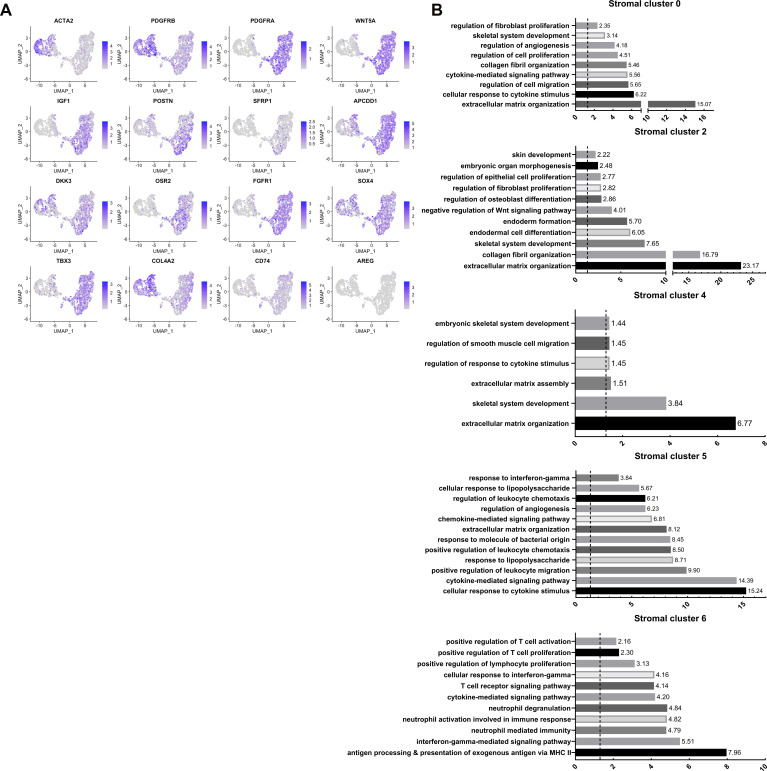
Figure 2. Cellular and molecular map of the stromal gingival compartment in health and disease identifies subpopulations with potential role in disease progression.
(A) UMAP plot of gingival stromal cells. Single cells coloured by cluster annotation. (B) UMAP plot of stromal cells during disease progression. (C) Heatmap showing subset-specific markers. (D) GO enrichment terms for S1 (myofibroblast) and S3 (pericyte). -log adjusted p-value shown (dotted line corresponds to FDR = 0.05). (E) Immunofluorescence staining showing COLVI, ACTA2 expression throughout disease progression. Scale bars, 100 μm. n = 3 patient samples/condition. Feature plots showing COLVI and ACTA2 expression across clusters and conditions. (F) UMAP annotated with CytoTRACE analysis to predict stromal stem populations. Transcriptional diversity is used here to predict maturation states. (G) Immunohistochemistry staining showing AEBP1+ cells tissue distribution. Scale bar, 100 μm. n = 6 patient samples.


