
Figure 3.
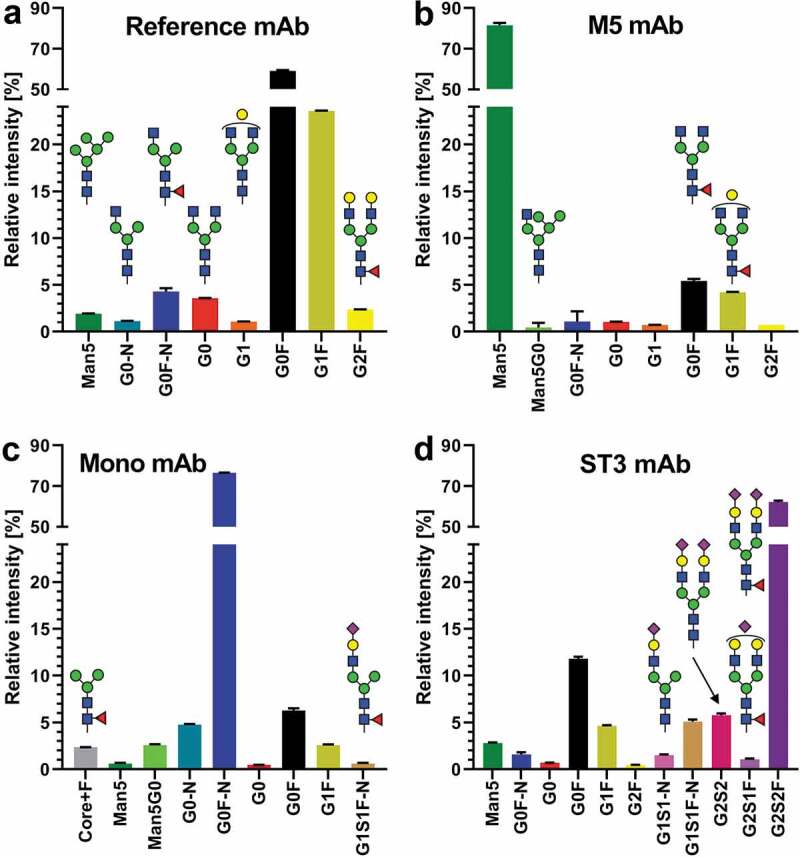
Glycosylation profiles of the four mAbs used in the rat PK study. All species are depicted which appear in any mAb >1% relative intensity (0.5% cutoff for visualization). The depicted values are obtained from LC-MS analysis of standards (thus not from material captured from animal serum). Complete glycoprofiling results can be found in Table S7