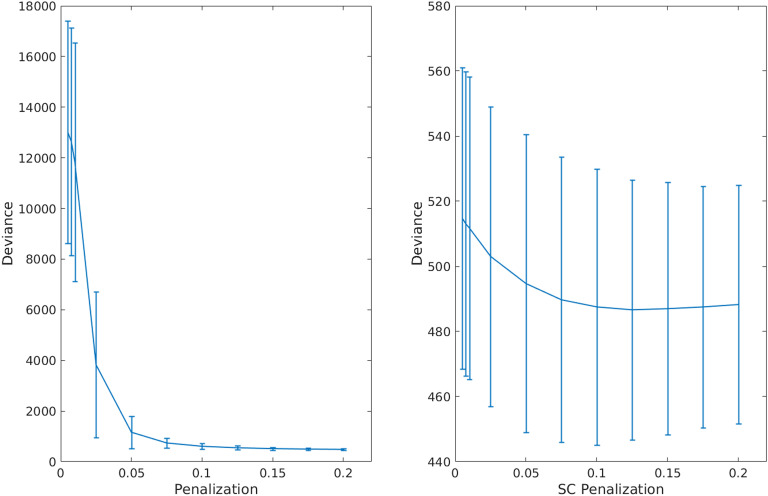
Figure 3. .
Cross-validation of graphical lasso (GL) and adaptive graphical lasso (AGL). We show performance (cross-validated deviance) across penalization for the GL (on the left) and AGL (right figure). The error bars represent the standard deviation of the deviance across patients. We found that for all but very high penalization the AGL outperformed the GL. Further, the AGL shows minimal cross-validated deviance for an optimal set of SC edges (at an SC penalization of 0.125) while the graphical lasso shows minimum deviance only for very sparse models.

