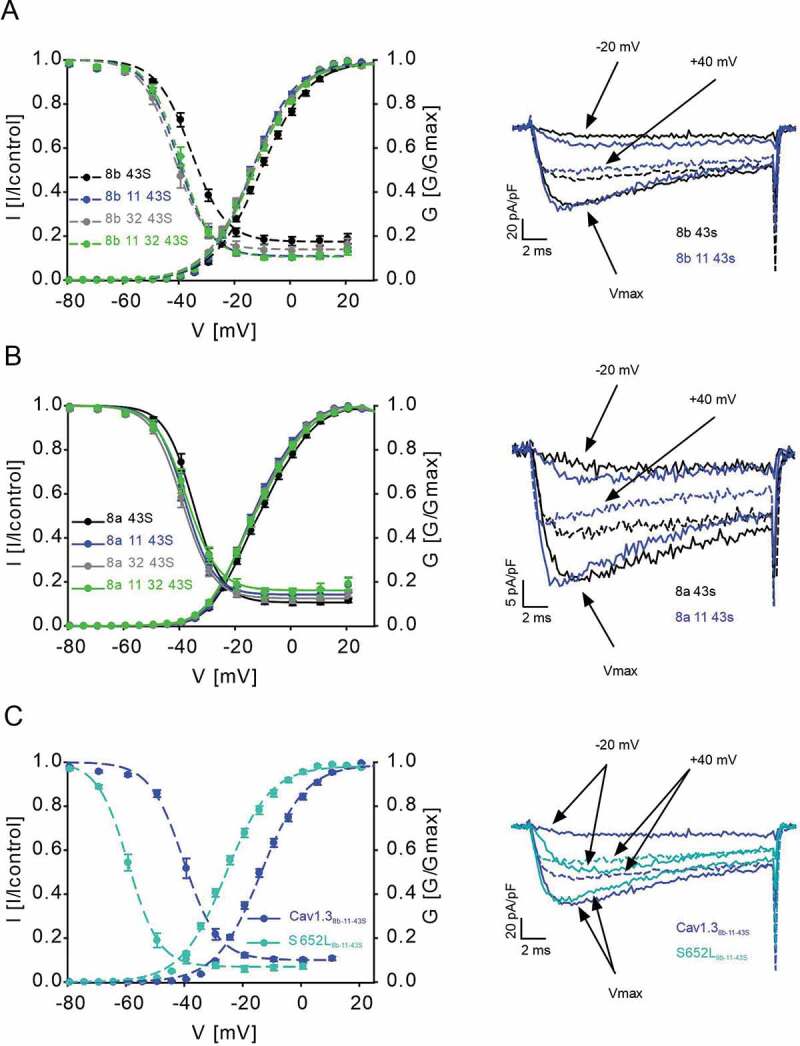
Figure 3.

Effects of Cav1.3 splicing outside the C-terminus on channel gating
Normalized steady-state activation and inactivation curves of Cav1.38b-43S (A) and Cav1.38a-43S (B) splice variants (left panels). All combinations shifted activation and inactivation to more hyperpolarized potentials compared to constructs lacking exons 11 and 32; for parameters and statistics see Table 1. C. Normalized activation and steady-state inactivation curves of Cav1.38b-11-43S vs S652L8b-11-43S (left panel); for parameters and statistics see Table 2. The pronounced shift of activation and inactivation voltage dependence induced by disease variant S652L was maintained in exon 11-containing channels. A-C right panels: Representative ICa traces recorded during test potentials of -20 mV, Vmax (solid lines) and +40 mV (dashed lines). Current amplitudes were normalized to the cell membrane capacitance (pA/pF). Currents <100 and >1000 pA were prospectively excluded from analysis. Data are presented as mean ± SEM and originate from >3 independent transfections for each construct.
