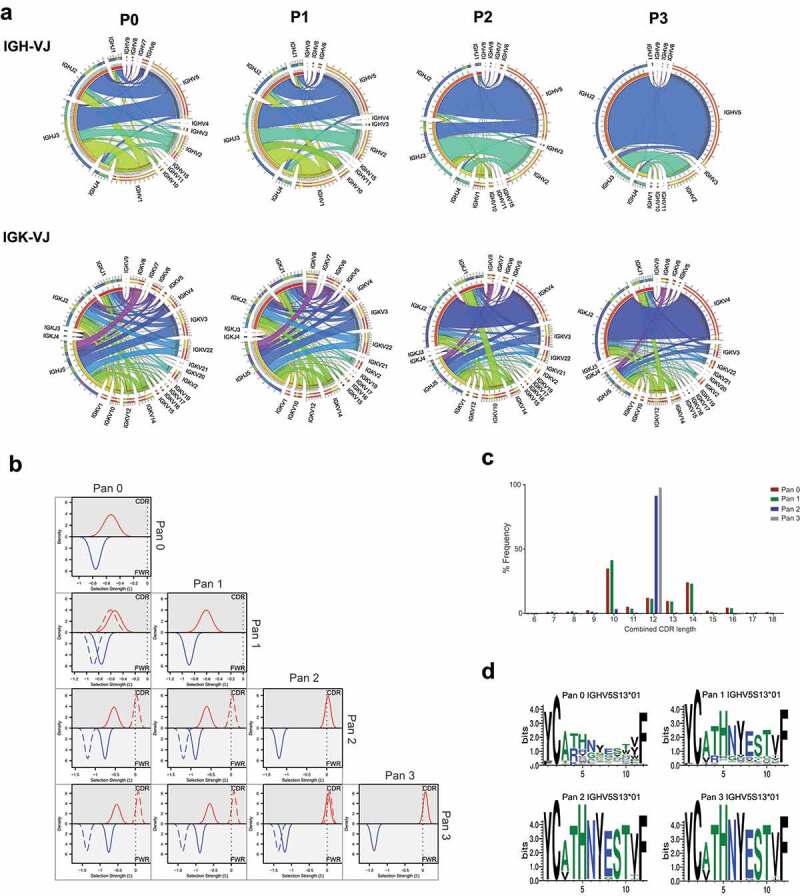
Figure 1.

Analysis of CD160 library diversity after phage display enrichment
[a] Chord diagram representation of the V and J gene frequency and their associations in phage display libraries. Pan 0 represents the unpanned library; pan1, pan2 and pan3 represent the library after the 1st, 2nd and 3rd round of panning, respectively. Correlation plots are shown between IGVH-IGVJ top panel and IGVK-IGVJ bottom panel. [b] Bayesian analysis of highest frequency IGHV genes at each round of panning. Plots are overlaid against analysis from alternative panning rounds to indicate difference in selection distribution. [c] CDR length distribution of all HCDR3 sequences derived from the IGHV5S13*01 germline chain. Amino acids length distribution at the HCDR3 position throughout the panning process. [d] Sequence logo plot of 12 AA length HCDR3 sequences derived from the IGHV5S13*01 germline chain.
