Figure 2.

Heavy and light chain pairing in phage libraries
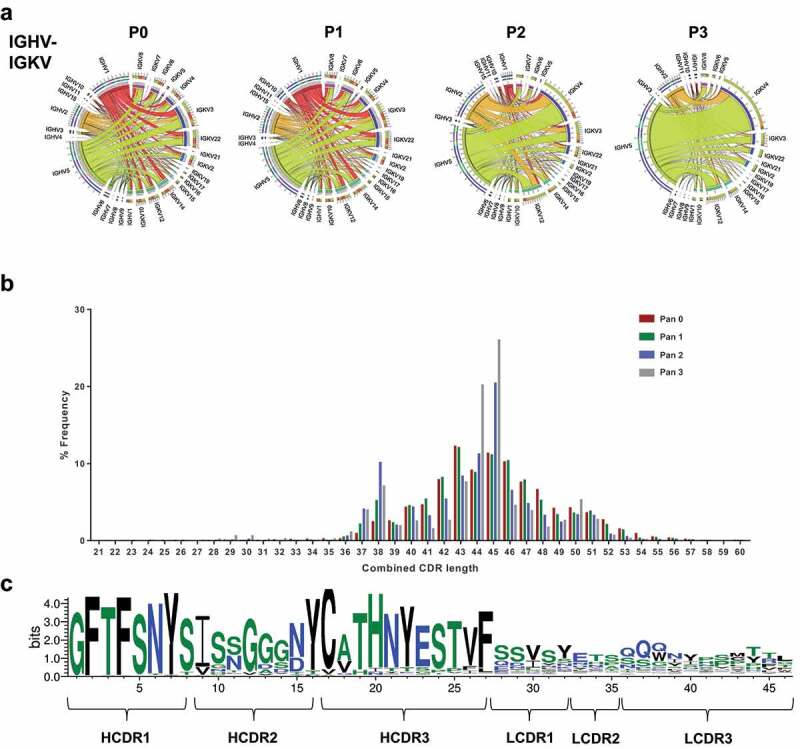
[a] Chord diagram representation of IGVH and IGVK frequency and their associations in phage display libraries. [b] CDR length distribution of all six CDRs from heavy and light chain of antibodies within the CD160 library derived from the IGHV5S13*01-IGVK1 pairs. [c] Sequence logo plot of all six CDRs from the heavy and light chain of antibodies within the preselected CD160 library derived from the IGHV5S13*01-IGVK1 pairs.
