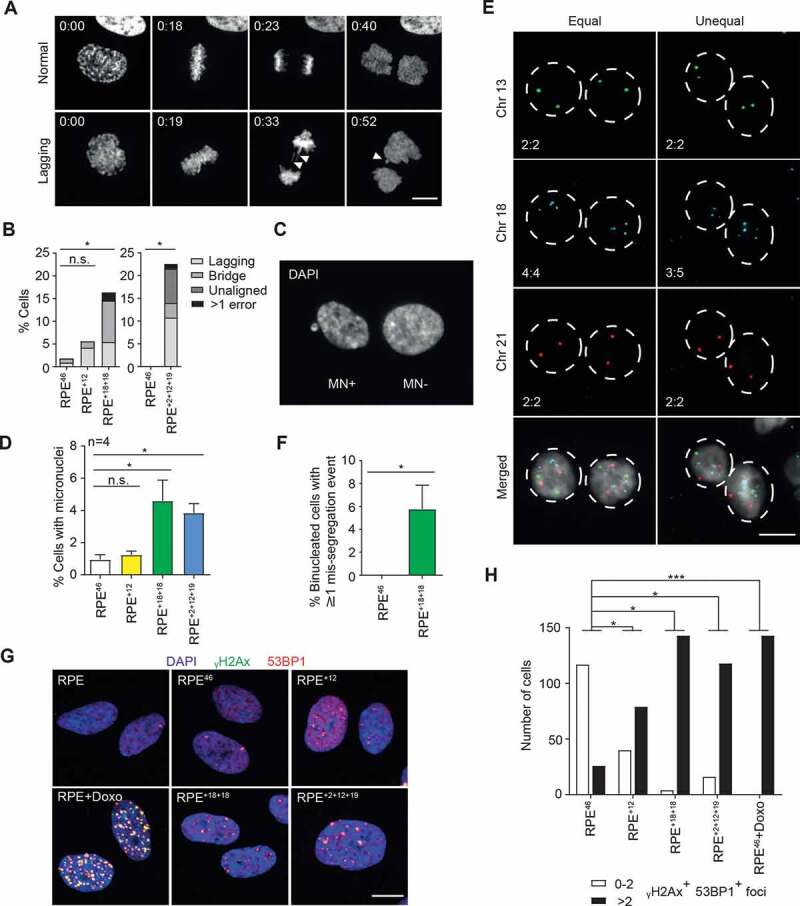
Figure 2.

Aneuploid RPE cell lines display ongoing genome instability despite a stable modal karyotype. A Time-lapse microscopy montage of H2B-mCherry RPE+18+18 cells undergoing mitosis. Top: normal mitosis; bottom: aberrant mitosis (presence of lagging chromosomes and micronuclei, white arrowheads). Time frames are indicated as hr:min after Nuclear Envelope Breakdown (NEB, t = 0). Representative movies are also available as supplementary (Movie EV1). B Quantification of mitotic errors in the indicated H2B-mCherry RPE clones from the time-lapse movies. RPE+2+12+19 and another set of control cells were analyzed on IX83 Olympus (n = 86–167; *p < 0.05 by Fisher’s exact test). C,D Representative image of cells containing (MN+) or lacking (MN-) micronuclei (c) and percentage of cells containing at least one micronucleus in the indicated lines (d). Shown are the average and SEM of four independent experiments (n ≥ 1000; *p < 0.05 by Student’s t test). E Representative images of chromosome-specific FISH hybridization in RPE+18+18 cell line after DCB-induced cytokinesis failure. Equal or unequal segregation: left and right columns, respectively. Chromosome numbers in the two daughter nuclei are shown bottom left. F Quantification of cells displaying at least one mis-segregation event as identified in (e). Data are presented as mean ± S.E.M. of three independent experiments (n = 500; *p < 0.05 by Student’s t-test). G Representative images of immunolabeling with γH2Ax and 53BP1 in the indicated cell lines and conditions (Doxo = doxorubicin 400 nM, 4 h); γH2Ax, 53BP1 and DAPI signals are overlaid. H Quantification of γH2Ax and 53BP1 positive foci in the indicated lines and conditions (n > 100 cells). The experiment was repeated twice with qualitatively similar results (*p < 0.05 and ***p < 0.001 by Fisher’s exact test)
