Figure 3.

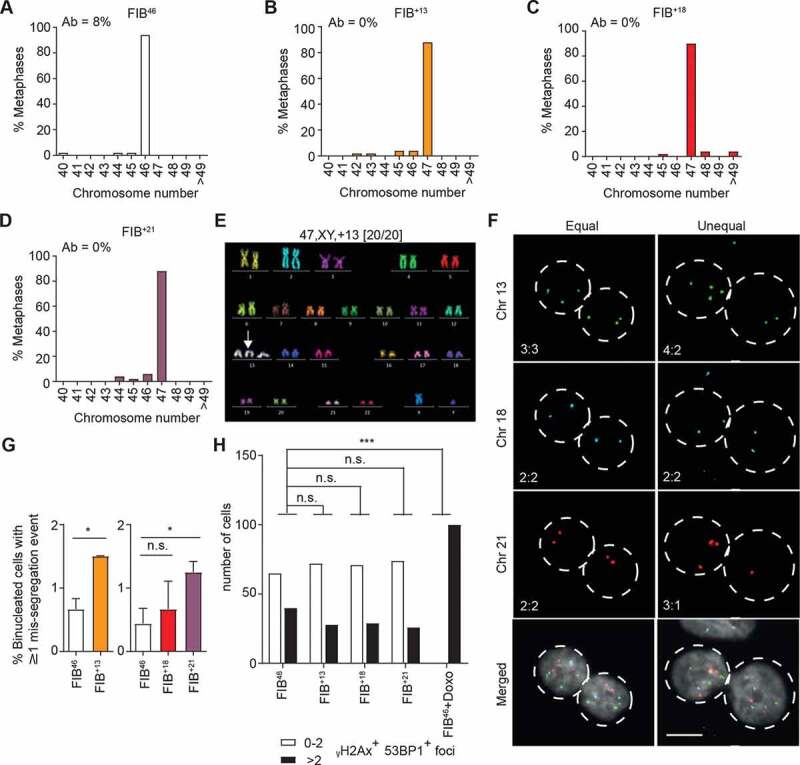
Primary aneuploid fibroblast cell lines are chromosomally unstable but maintain a stable karyotype. A-D Chromosome counting from metaphase spreads of the indicated euploid and aneuploid primary fibroblasts (n = 50); percentages of cells with structurally aberrant chromosomes (Ab) are shown top left. E Representative pseudo-colored image from M-FISH hybridization karyotyping of a FIB+13 cell. Karyotype is indicated on top with the number of cells analyzed in brackets. White arrow: trisomic chromosome. F Representative images of chromosome-specific FISH hybridization in FIB+13 cells after DCB-induced cytokinesis failure. Equal or unequal segregation: left and right column, respectively. Chromosome numbers in the two daughter nuclei are shown bottom left (scale bar: 10 µm). G Percentage of cells displaying at least one mis-segregation event in the indicated cell lines. Data are presented as mean ± S.E.M. of three independent experiments (n ≥ 522); *p < 0.05 by Student’s t-test. H Quantification of γH2Ax and 53BP1 positive foci in the indicated lines and conditions (Doxo = doxorubicin 400 nM, 4 h) after immunoblotting staining (n > 100 cells). The experiment was repeated twice with qualitatively similar results (***p < 0.001 by Fisher’s exact test)
