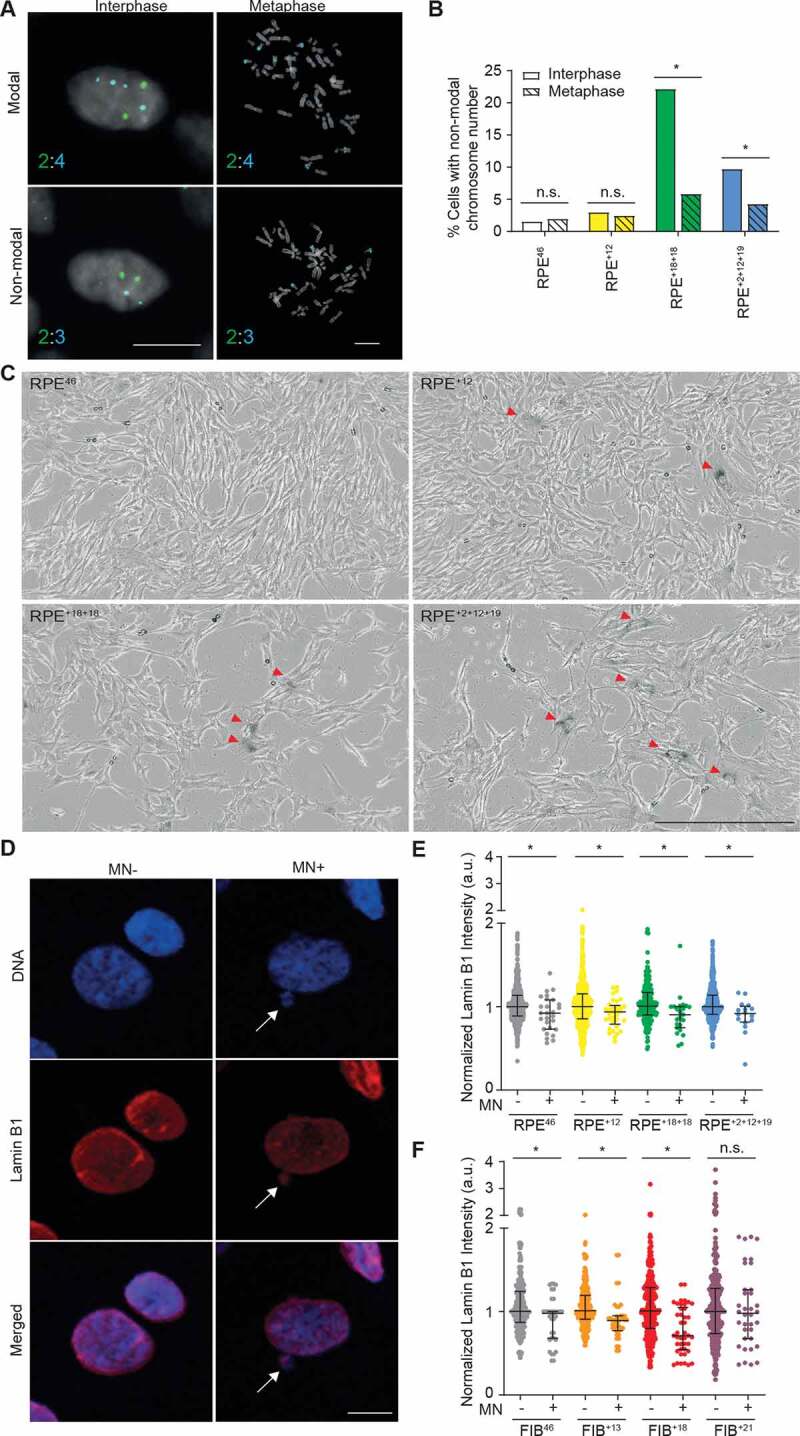
Figure 4.

Cell cycle arrest following chromosome mis-segregation. A Representative images of interphase or metaphase FISH using specific probes for chromosomes 13 (green, 2 copies) and 18 (aqua, 4 copies) in the RPE+18+18 cell line. Chromosome counts per cell are shown bottom left. Top and bottom row: cells displaying modal or non-modal distribution of chromosomes 13 and 18, respectively (scale bar: 10 µm). B Quantification of interphase (solid) or metaphase (pattern) cells with non-modal distribution of chromosomes 13 and 18 in the indicated cell lines. A total of 300–450 interphase and 85–200 metaphase cells were scored (*p < 0.05 by Fisher’s exact test). C Representative images of β-galactosidase assay performed on the indicated cell lines (scale bar: 400 µm). Red arrowhead indicate senescence cells. D Representative images of Lamin B1 immunofluorescence in RPE+18+18 cells with (MN+) or without (MN-) micronuclei (indicated by the white arrow). DNA was stained with DAPI (scale bar: 10 µm). E,F Quantification of normalized Lamin B1 intensity in MN- and MN+ cells from the indicated cell lines. A total of 16–42 MN+ and 235–756 MN- cells were quantified and two biological replicates were performed with qualitatively similar results. Error bars represent the median and interquartile ranges (*p < 0.05 by Mann-Whitney test)
