Figure 5.

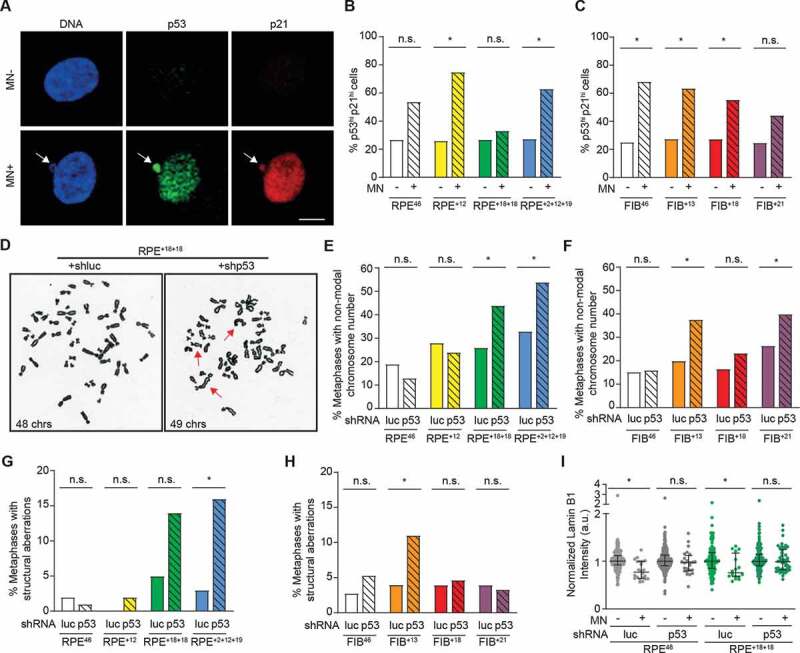
P53 restrains the growth of chromosomally unstable daughter of aneuploid cells. A Representative images of p53 and p21 immunofluorescent staining in RPE+2+12+19 cells with (MN+) and without (MN-) micronuclei (white arrow). DNA was stained with DAPI (scale bar: 10 µm). B,C Quantification of MN- and MN+ cells with high p53 and p21 staining in the indicated cell lines (*p < 0.05 by Fisher’s exact test). Normalized p53 and p21 immunofluorescence levels per cell are reported in EV3. D Representative metaphase spreads of p53 knockdown (shp53) or control (shLuc) RPE+18+18 cells (red arrows: structural chromosome aberrations). E,F,G,H, Percentage of cells in the indicated lines carrying p53 knock down or control with (e-f) a chromosome number different from the modal karyotype (RPE46 and FIB46 = 46; RPE+12 and aneuploid fibroblasts = 47; RPE+18+18 = 48 and RPE+2+12+19 = 49) or with (g-h) structural chromosome aberrations (n = 50 metaphase spreads from two independent experiments; *p < 0.05 by Fisher’s exact test). I Normalized LaminB1 quantification in MN- and MN+ cells from p53 knockdown (shp53) or control (shLuc) RPEWT or RPE+18+18 lines (n = 16–46 MN+ cells; n = 124–364 MN- cells). Error bars represent the median and interquartile ranges (*p < 0.05 by Mann-Whitney test)
