Figure 6.

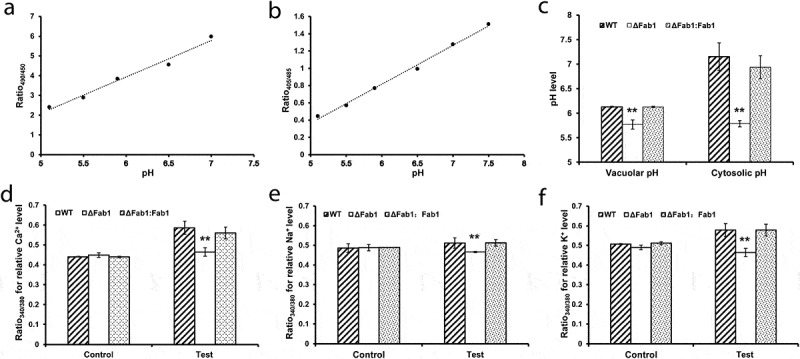
Impacts of fab1 deletion on cellular acidification and metal ion homeostasis. (a) Calibration curve showing the ratio of fluorescence intensity from excitation at 490 nm to intensity from excitation at 450 nm at different pH values. (b) Calibration curve showing the ratio of fluorescence intensity from excitation at 405 nm to intensity from excitation at 485 nm at different pH values. Wild-type cells were stained with BCECF-AM fluorescent dye and then equilibrated with buffers at varied pH for 60 min. A linear trendline is shown. (c) Vacuolar and cytosolic pH in WT, ∆fab1 and ∆fab1::fab1 strains. All strains were stained with BCECF-AM fluorescent dye and the fluorescence ratios were measured and converted to pH using the calibration curves. (d-f) Relative levels of intracellular Ca2+, Na+ and K+ in WT, ∆fab1 and ∆fab1::fab1 strains. All strains were stained with the specific fluorescent indicator dyes Fura-2-AM, SBFI-AM and PBFI-AM, respectively. The relative concentrations of Ca2+, Na+ and K+ in the cytoplasm were calculated based on the fluorescence ratio (Ratio 340/380). The unstained strains were used as controls. Data are presented as means ±S.D. and represent the results of three independent experiments. **p < 0.01
