Figure 8.

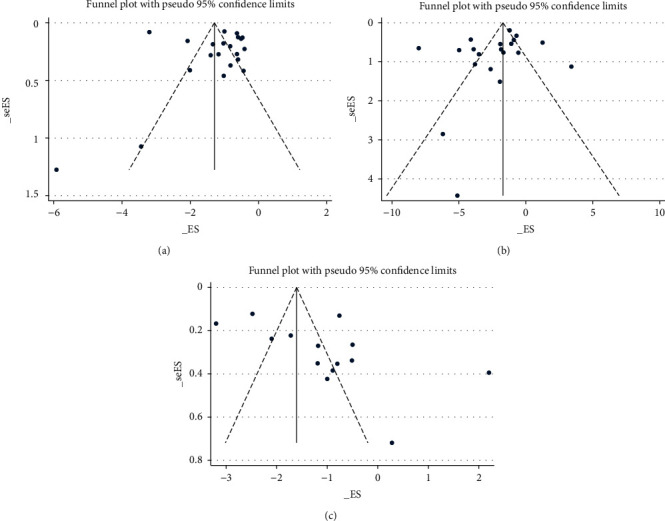
Funnel plot. (a) Migraine frequency at the end of treatment. (b) Migraine attack duration at the end of treatment. (c) Pain VAS at the end of treatment; VAS, visual analogue scale.

Funnel plot. (a) Migraine frequency at the end of treatment. (b) Migraine attack duration at the end of treatment. (c) Pain VAS at the end of treatment; VAS, visual analogue scale.