
Figure 2.
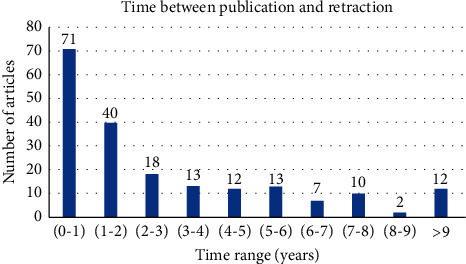
Graph showing the time duration between original paper publication and its retraction. N = 198.
Official websites use .gov
A
.gov website belongs to an official
government organization in the United States.
Secure .gov websites use HTTPS
A lock (
) or https:// means you've safely
connected to the .gov website. Share sensitive
information only on official, secure websites.
Graph showing the time duration between original paper publication and its retraction. N = 198.