
Figure 4.
All DEG PPI networks are visualized via Cytoscape. Red balls represent upregulated genes, and blue diamonds represent downregulated genes. (a) RA and No-RA groups. (b) M-RA and F-RA groups.
Official websites use .gov
A
.gov website belongs to an official
government organization in the United States.
Secure .gov websites use HTTPS
A lock (
) or https:// means you've safely
connected to the .gov website. Share sensitive
information only on official, secure websites.
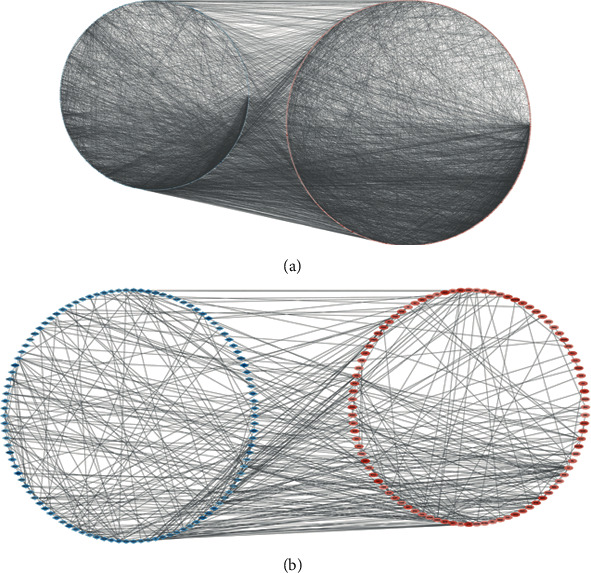
All DEG PPI networks are visualized via Cytoscape. Red balls represent upregulated genes, and blue diamonds represent downregulated genes. (a) RA and No-RA groups. (b) M-RA and F-RA groups.