
Figure 5.
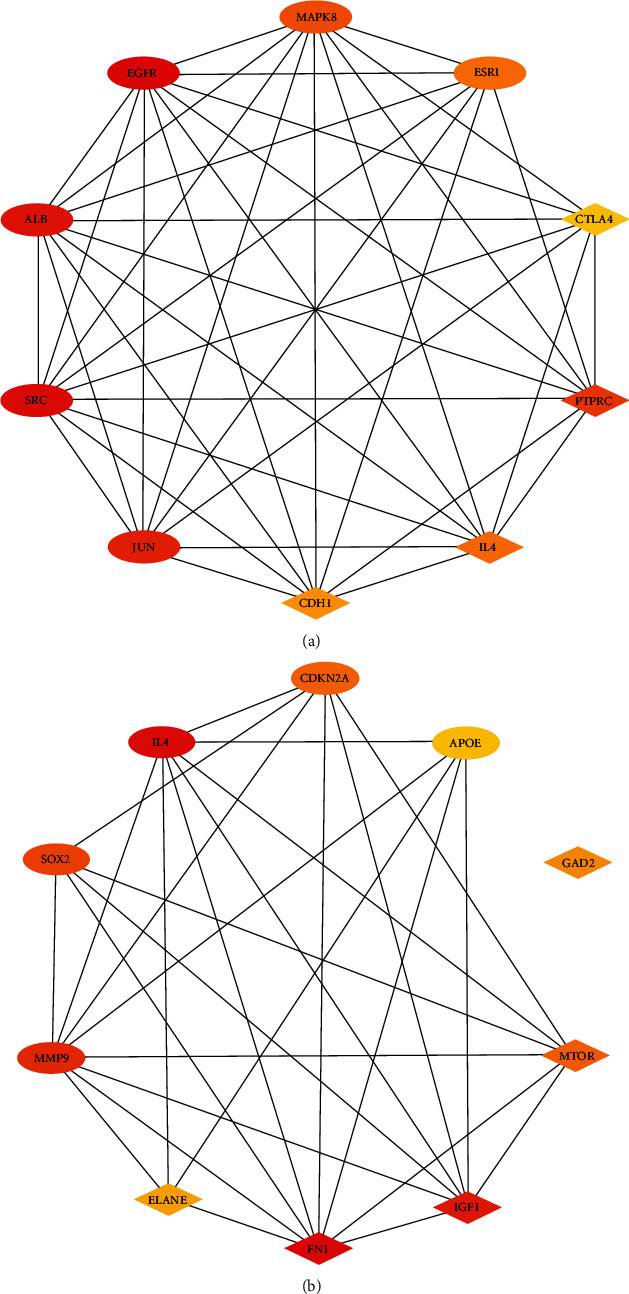
Top 10 genes in degree score from CytoHubba. (a) RA and No-RA groups. (b) M-RA and F-RA groups. The balls represent the upregulated genes, and the diamonds represent the downregulated genes.
Official websites use .gov
A
.gov website belongs to an official
government organization in the United States.
Secure .gov websites use HTTPS
A lock (
) or https:// means you've safely
connected to the .gov website. Share sensitive
information only on official, secure websites.
Top 10 genes in degree score from CytoHubba. (a) RA and No-RA groups. (b) M-RA and F-RA groups. The balls represent the upregulated genes, and the diamonds represent the downregulated genes.