
Figure 8.
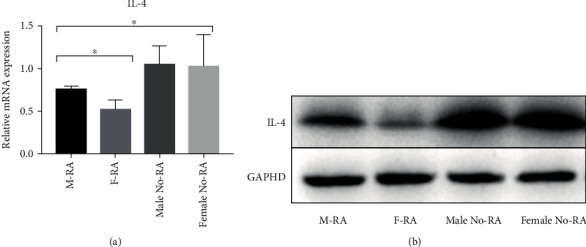
The expression of IL-4 in the RA group was lower than that in the No-RA group (P < 0.05). The expression of IL-4 in the F-RA group was lower than that in the M-RA group (P < 0.05). (a) Quantitative real-time PCR. (b) Western blot analysis. ∗P < 0.05.