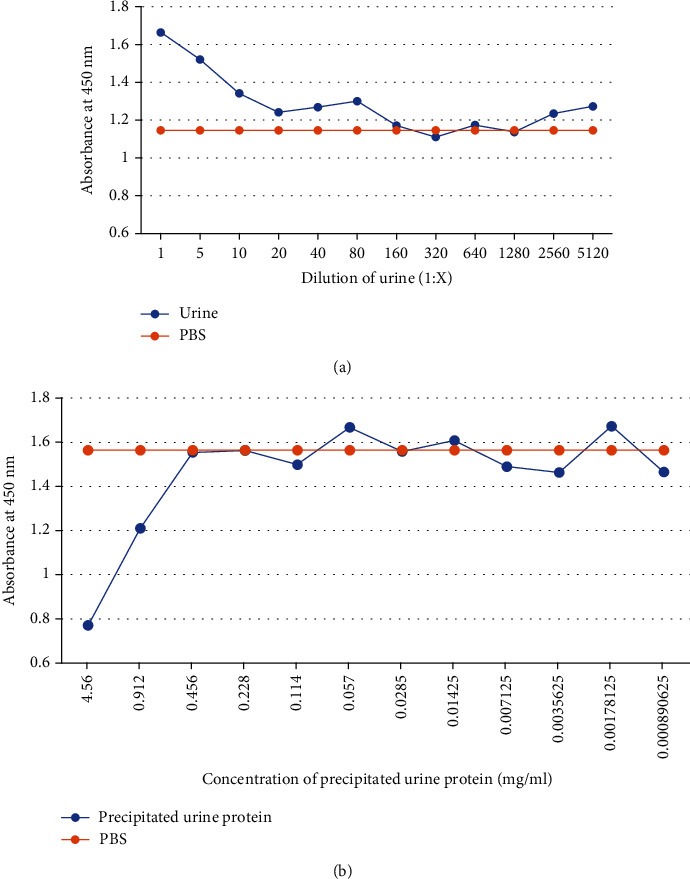
Figure 2.

Observation of the urine matrix effect using ic-ELISA. (a) The curve was obtained using analyte 12 dilutions of pooled urine prepared in PBS buffer (1 : 1–1 : 5120). (b) The curve was obtained using analyte 12 concentrations of precipitated urine protein prepared in PBS buffer (0.001-4.56 mg/ml).
