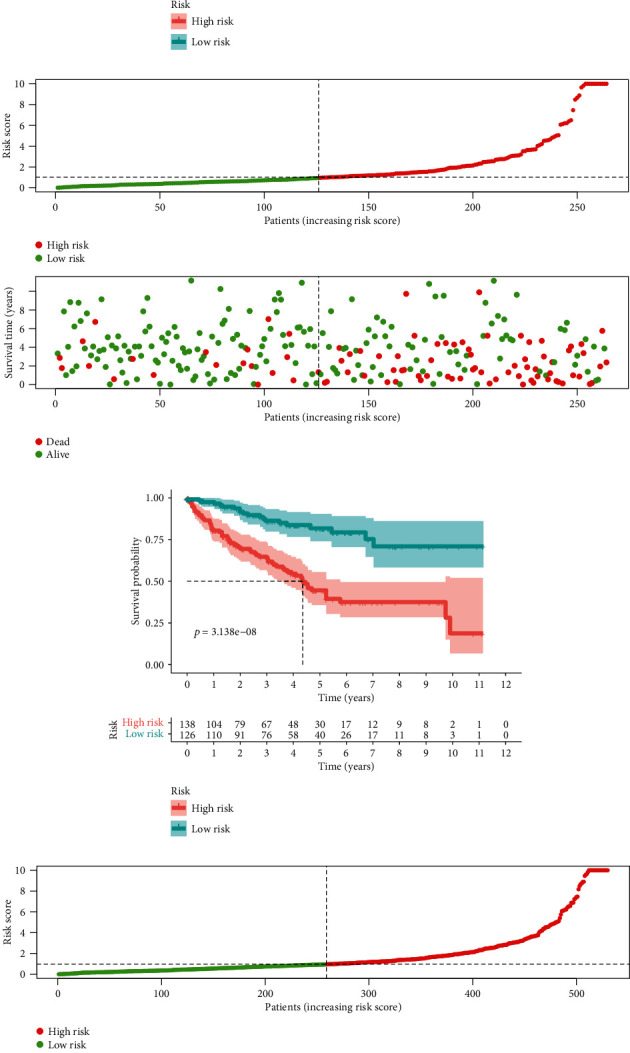
Figure 2.

Risk plot and survival curves. (a) Risk plot of the training group. (b) Survival curve of the training group. (c) Risk plot of the test group. (d) Survival curve of the test group. (e) Risk plot of all samples. (f) Survival curve of all samples.
